
Advanced chart reading

A friend sends a screenshot of a gold chart. Every candle looks smooth, almost every one green in a row, stacked like a ladder going straight up. No long wicks, no messy back and forth. The indicator "removes the noise," they say, and shows the real trend. Next to your own ragged chart, theirs looks calmer.
A week later another trader draws five swings on that stretch of price and says gold is about to turn, because the last leg is "wave five." A third draws four connected lines over a different section, names a pattern you have never heard of, and points to the exact reversal zone. All three sound sure. None of them agree with each other.
The idea in plain words
Heikin Ashi, an averaged candle
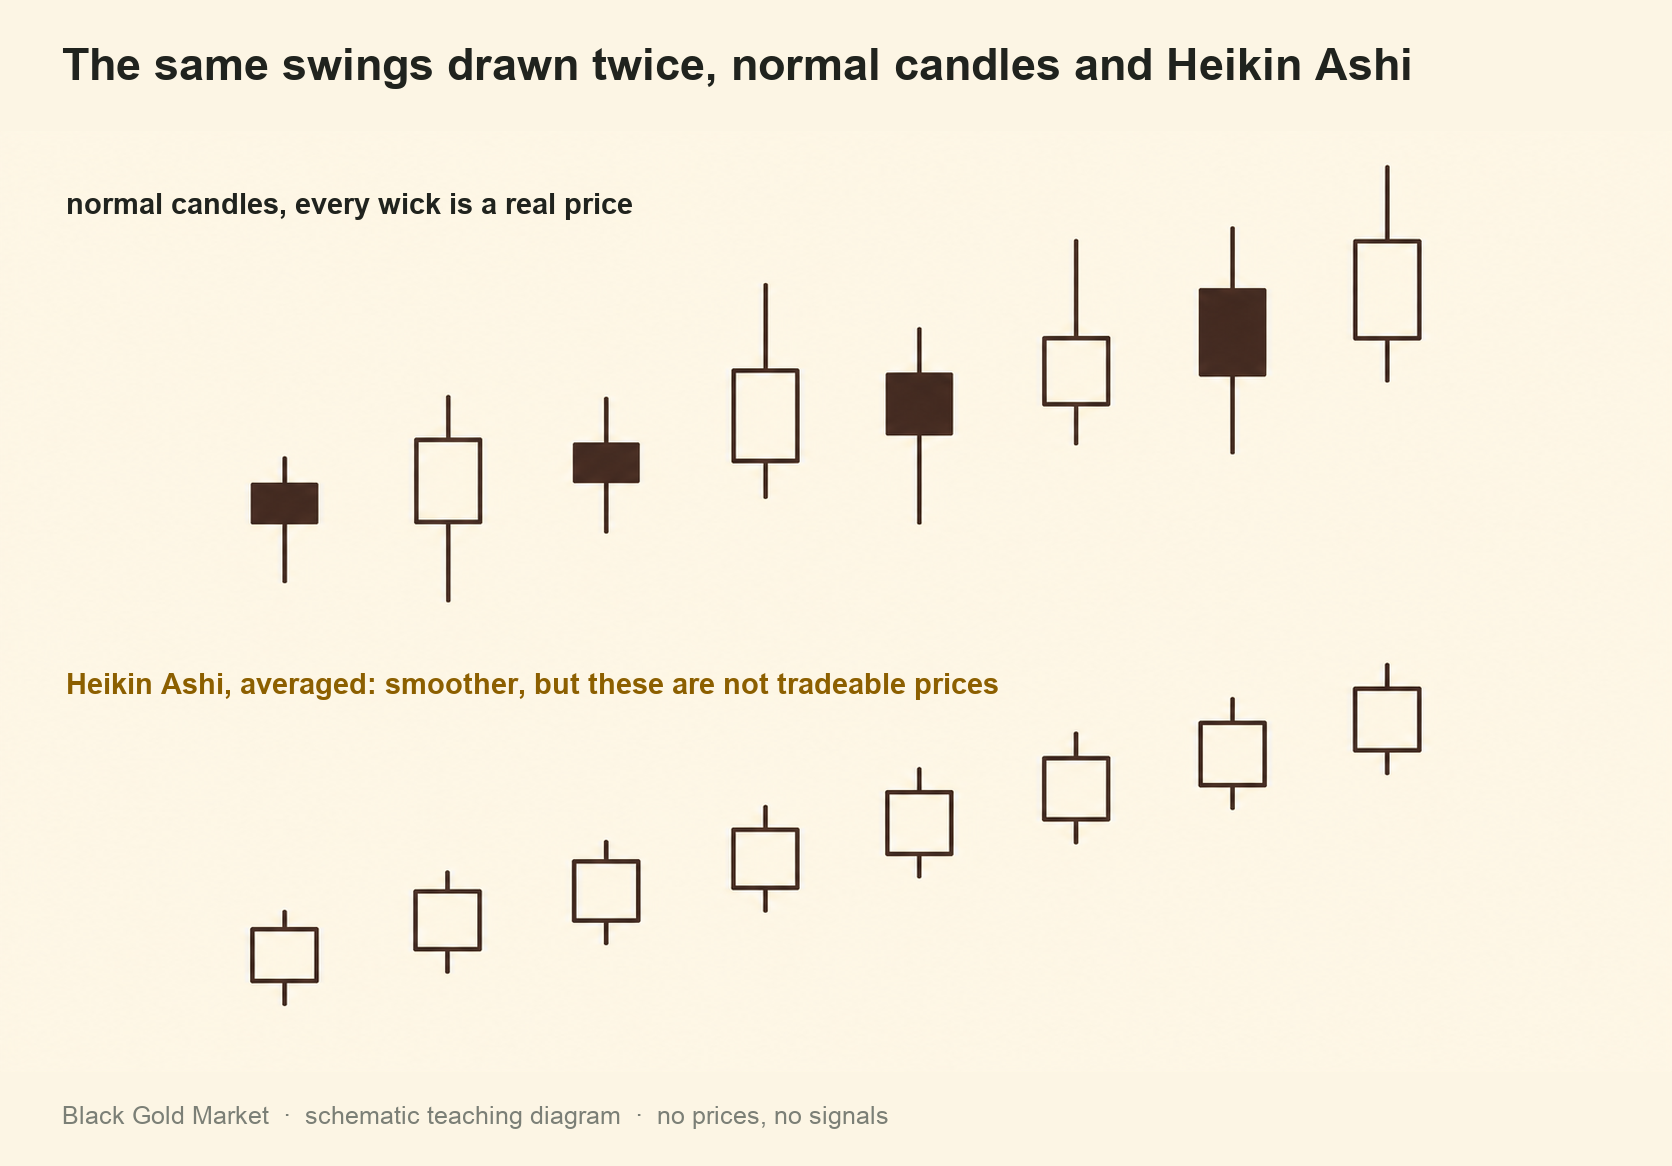
Heikin Ashi roughly means average bar. A normal candle plots the open, high, low and close that actually traded. A Heikin Ashi (HA) candle plots four calculated values built from the current candle and the HA candle before it. HA close averages the current open, high, low and close. HA open averages the previous HA open and close. HA high is the largest of the current high, the new HA open and close. HA low is the smallest of the current low, the new HA open and close.
Each new HA open leans on the candle before it, so small reversals get absorbed into the body instead of a color change, which is why HA runs look tidier. The open and close were never prices anyone traded at, and the true high and low get folded in too, so an HA wick can understate how far price actually reached. Orders and stops still belong on the normal chart's real high and low, never the HA numbers.
Elliott wave counting, five and three
Ralph Elliott's idea, from the 1930s, is that a trend unfolds in five swings, labeled 1 through 5, followed by three corrective swings against it, labeled A, B and C. The honest problem is where the count starts. Two people on the same chart and timeframe can pick a different starting swing and land on a different wave three, and a count that looked finished last week often gets relabeled once price surprises it. That is normal practice, not a rare mistake, since the starting point is always a judgment call.
Harmonic patterns, ratio based shapes
Harmonic patterns look for four connected swings whose lengths sit near specific Fibonacci ratios, the same family used in retracement and pivot work, such as 0.618, 0.786 or 1.27 of a prior swing. Match enough ratios and the pattern gets a name and a reversal zone. The three decimal ratios look precise, but most versions accept a tolerance range, not an exact number, and a chart offers hundreds of candidate swings, so a patient trader can usually find four that fit almost any shape they were hoping to see.
All three describe price that already happened, in a tidier shape than the raw chart. None of them certify what happens next. Pair every one with a price that would prove the idea wrong, or it is only a confident looking story.
A worked example
This bar is invented for practice, not a real quote. A 15 minute candle prints open 100.0, high 106.0, low 98.0, close 104.0. The previous HA candle was already calculated as HA open 99.0 and HA close 101.0.
- HA close, average the four prices. (100.0 + 106.0 + 98.0 + 104.0) / 4 = 102.0.
- HA open, average the previous HA open and close. (99.0 + 101.0) / 2 = 100.0.
- HA high, the largest of 106.0, 100.0 and 102.0, so 106.0.
- HA low, the smallest of 98.0, 100.0 and 102.0, so 98.0.
The HA candle shows open 100.0, close 102.0, high 106.0, low 98.0, a small green body inside a tall wick. But the real candle moved from 100.0 to 104.0, a 4.0 point move, and reached as high as 106.0 and as low as 98.0, an 8.0 point range. Reading only the HA body hides that 8.0 point swing. No real trade took place, so no costs apply, this is arithmetic practice only.
Where the three tools compare
| Tool | Built from | Often used to claim | Real limitation |
|---|---|---|---|
| Heikin Ashi | Averages of the current and prior HA candle | A cleaner read of trend | Displayed prices are not tradable |
| Elliott wave count | Labeled sequence of swings | Where price sits in a bigger cycle | Starting point is a judgment call |
| Harmonic pattern | Four swings against Fibonacci ratios | A precise reversal zone | Wide tolerance lets unrelated swings fit |
Where people go wrong
Trading the HA body like a live quote. An order gets placed at an HA open or close as if it were dealt on the market. That number was never real, so the fill lands somewhere never planned for.
Setting a stop from the HA high or low. An HA wick can be shorter than the real one, so a stop measured against it can sit inside a zone price already reached, triggered by a swing HA never showed.
Forcing a count or pattern to fit a bias that came first. A trader decides gold should turn lower, then hunts for a shape that agrees. When price breaks the level that should disprove it, the count gets relabeled instead of closed out.
Your turn
- On a demo chart, record the open, high, low and close of the last three daily candles in Heikin Ashi, then again in normal candles. Note where the real high or low was further out than HA suggested.
- Count five swings that fit an Elliott style move in a recent trend. Before accepting the count, write the exact price that would break it. If price crosses that level, cross the count out rather than relabeling it.
- Find four connected swings that resemble a harmonic shape. Write the price that would prove the reversal zone wrong, and check whether it differs from an ordinary support or resistance zone you would have drawn anyway.
Check yourself
Why can't the open and close shown on a Heikin Ashi candle be used as your actual order price?
Both are averages built from the current candle and the one before it. No one transacted at that level, so an order depends on the real market, not the HA math.
If two analysts draw two different Elliott wave counts on the same chart, what is the count still useful for?
It can describe a plausible structure and suggest where a move looks early or stretched, but it only becomes testable once paired with a price that would prove it wrong.
What makes harmonic patterns easy to force onto a chart that was not really moving that way?
The ratios use a tolerance range, not an exact number, and a chart offers many candidate swings, enough that an analyst can usually find four that loosely fit whichever pattern was expected.
Every tool here describes price that already happened. The next lesson steps back and asks why price moves at all, starting with interest rates and what the market expects a central bank to do next.