
Technical toolkit

You mark a swing low and a swing high on the gold chart, drag the Fibonacci tool between them, and stare at a fan of lines that suddenly look important. One of them, the 61.8% level, has a reputation. Price stalls near it once, then twice, and you start to feel like the tool has found something hidden inside the market.
Then you redraw the same tool from a different swing, five candles to the left, and every line moves. The level that felt magic a minute ago now sits somewhere else entirely. Nothing about gold changed in that minute. Only your two clicks changed.
The idea in plain words
A Fibonacci retracement is a set of horizontal lines drawn between two points you choose, a swing low and a swing high, or the reverse in a downtrend. The tool takes the distance between those points and marks off fixed fractions of it. The fractions most traders watch are 23.6%, 38.2%, 50% and 61.8%, with 78.6% used less often. A pullback stalling near the 50% line has given back half the prior move. One reaching 61.8% has given back nearly two thirds of it.
Be honest about why these levels sometimes work. Gold does not obey a number sequence discovered centuries ago for something else entirely. It works partly because thousands of other traders draw the same lines on the same swing and place orders near the same numbers. When enough people watch one price at once, it can become a real area of interest for a while, simply because so many are looking there together. That is a crowd effect, not proof of a hidden rule, and it will not hold every time.
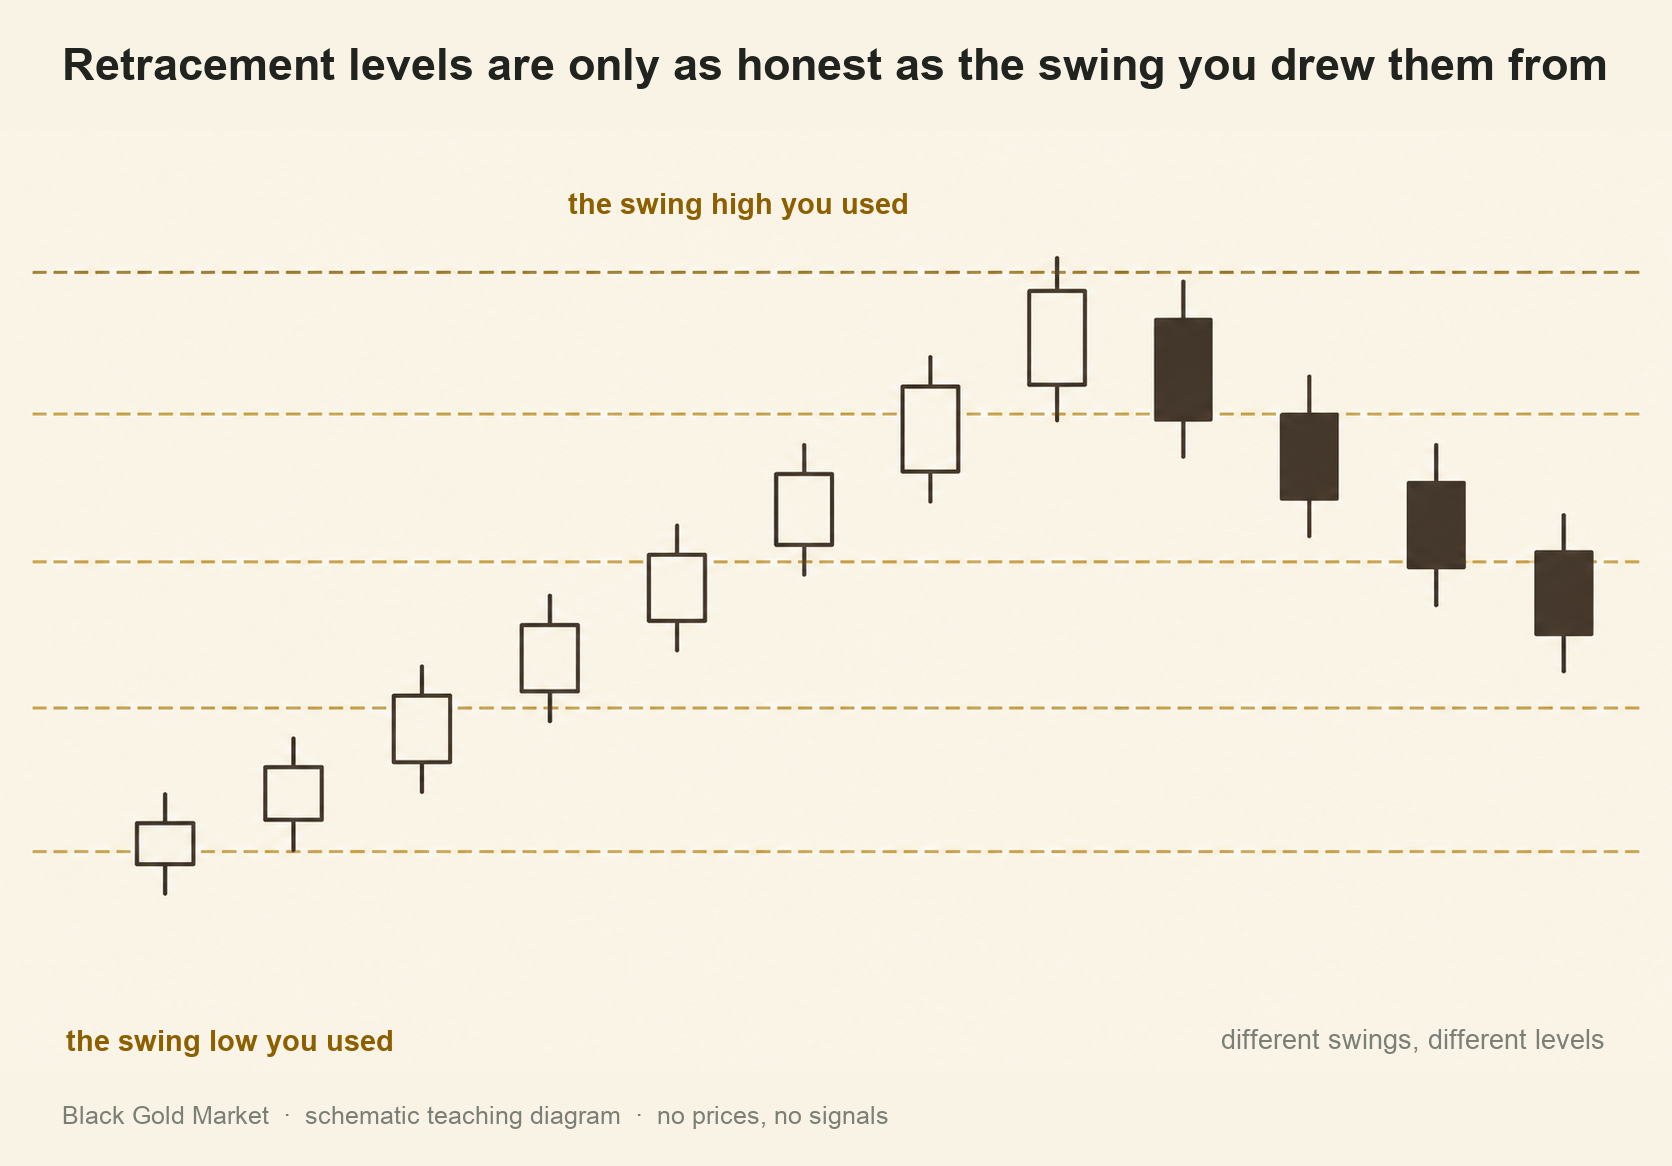
Here is the catch, and the distrust it earns the tool is fair. The two points you pick are a judgment call, not a fact read off the chart. A different swing low, a different swing high, or one step back a timeframe, and the whole ladder shifts under you. Two traders on the same chart can draw two different sets of levels and both call theirs correct. The fix is a habit. Anchor on a swing genuinely visible in price structure, and write down which two points you used before you see what price does next. If you cannot say which swing you anchored on, the level is not something you can defend later.
Classic pivot points are built differently, and that removes some of the guesswork. A pivot point uses three fixed numbers from the previous session, the high, the low and the close. Those numbers are settled the moment the session ends, so everyone calculating from that session lands on the same answer. Pivots remove the anchor argument, but they only describe one session, and the ladder resets the next day.
A worked example
These numbers are invented, a practice sheet, not a market call.
Pivot point. Say the previous session closed with a high of 120, a low of 100 and a close of 114, plain practice numbers rather than a live quote. The pivot is the average of those three, 334 divided by 3, which is 111.3. First resistance is twice the pivot minus the low, 122.6. First support is twice the pivot minus the high, 102.6. Those three numbers form your reference ladder for the next session.
Fibonacci retracement. Say a swing low sits at 100 and the swing high that followed it sits at 200. The move is 100 points. A 61.8% retracement measures 61.8% of that move back down from the high, so 0.618 times 100 is 61.8. Subtract that from the high and the level sits at 138.2. A pullback toward 138.2 has given back roughly two thirds of the move up, no more and no less.
Fibonacci retracement vs pivot points
| Fibonacci retracement | Pivot points | |
|---|---|---|
| How it is built | Fixed fractions of the distance between two swing points you choose | A fixed formula run on the previous session's high, low and close |
| What it depends on | Your judgment about which swing to anchor on | The previous session's actual numbers, no judgment involved |
| How often it changes | Only when you redraw it on a different swing | Every new session |
Where people go wrong
Picking the swing after seeing the bounce. A trader looks back, sees where price already turned, then draws the retracement so a level lands right on that turn. It looks perfect in hindsight and proves nothing, because the answer was visible before the swing was chosen. In real time, before the turn happens, the same trader will not draw it so cleanly.
Trading the level on its own. Price touches the 61.8% line or a pivot line and the trader enters immediately, with no candle behavior and no structure behind it. A level is a coordinate, not a signal. Plenty of touches pass straight through, and treating every one as an entry produces a run of low quality trades.
Mixing timeframes without noting it. A retracement drawn on the four hour chart gets used to trade the one minute chart, or a trader thinks in weekly terms while calculating only daily pivots. A level valid on the timeframe it was built for can be irrelevant on the one being traded, leading to entries taken too early or too late.
Your turn
- Open a demo chart of gold. Mark the most recent clear swing low and swing high, and write down the two prices before you draw anything.
- Draw the retracement tool between those points and record the 38.2%, 50% and 61.8% levels.
- Using the previous day's high, low and close, calculate the pivot point and first support and resistance by hand, then check against the platform.
- Move your swing low anchor to a slightly earlier low and redraw. Note how far every level shifted.
- For one paper idea, check whether the level lines up with a support or resistance area you would have marked anyway, with no tool involved.
Check yourself
What two points do you need to draw a Fibonacci retracement, and why does moving either one change every level on the chart?
A swing low and a swing high, or the reverse in a downtrend. Every level is a fixed fraction of the distance between those points, so moving either one changes that distance and every level with it.
What three numbers does a classic pivot point use, and where do they come from?
The previous session's high, low and close. Because those numbers are fixed once the session ends, anyone using that same session arrives at the same pivot.
Why might Fibonacci and pivot levels sometimes seem to work, even though neither is based on anything physical about gold itself?
Large numbers of traders watch the same levels and place orders near them, so a level can become a crowded area of interest for a while. That is a crowd effect, not a guarantee that price reacts there again.
A pivot ladder or a retracement level only tells you where to look, not what the candles do once price arrives, and that gap is where the next lesson picks up, patterns and divergence.