
Chart foundations

You open the five minute chart and one candle takes up half the screen. It shot up, stalled, then fell back before the close. Your first thought is that something big just happened. Your second thought is that you have no idea what to do about it.
That candle is not hiding anything. It recorded exactly what happened, no more and no less. The trouble is rarely the data, it's what you decide the data means. A trader working from a plan looks at the same shape, notes it, and moves on, because one candle is a fact about the past, not an order for the next one.
The idea in plain words
A candle summarizes price during one fixed slice of time, a minute, an hour, a day, whatever the chart is set to. Four numbers build it, the open, high, low and close of that interval. Everything else on the chart comes from those four.
The body is the block between open and close, usually colored to show direction. The wicks, sometimes called shadows, are the thin lines above and below it, marking the high and low the price visited but did not hold onto by the close. A long wick with a small body means price traveled and got pushed back. A long body with short wicks means price moved one way and stayed there.
The same shape does not carry the same weight everywhere. A long lower wick at the bottom of a two week decline is different evidence from that same wick in the middle of a range going nowhere. A wick formed in a quiet holiday session is different evidence from one formed in a normal, liquid session. Shape is only half the story, where it sits is the other half.
Timeframe matters too. A candle on a five minute chart and one on a daily chart are not the same kind of evidence, even when they look alike. A five minute candle can be built from a handful of orders in a thin moment. A daily candle compresses a full day into one shape, so it reflects far more participation. Neither is wrong, they answer different questions.
This is also why rule based traders care more about where a candle closed than where it poked mid interval. The close is a finished decision, the last agreed price once the period was done. A high or low reached partway through can reverse before the candle finishes, so most plans that define an entry off a candle wait for it to close first.
Here is the honest limit. No single candle shape, however dramatic, predicts what the next candle will do. It is a record of what already happened, not a forecast, like a thermometer reading the temperature now, not tomorrow's. Treat each shape as one data point folded into your read of trend and level, not a signal on its own.
A worked example
Here is a hypothetical candle, invented for this lesson, not a real quote or a trade idea. Say a gold contract opens an hourly candle at 2,410.0, prints a high of 2,417.0 and a low of 2,406.5, then closes at 2,415.5.
The range is high minus low, 10.5. The body is close minus open, 5.5, a bullish candle since the close finished above the open. The close is the higher of the two, so the upper wick is high minus close, 1.5. The open is the lower one, so the lower wick is open minus low, 3.5. Add the three parts back, 5.5 plus 1.5 plus 3.5 equals 10.5, matching the range exactly.
As shares of the range, the body is about 52 percent, roughly half the hour's movement stuck as a net gain. The lower wick is about 33 percent, the larger of the two, so some early selling was met and pushed back. The upper wick is only about 14 percent, so the close sits near the top without quite reaching it. This is arithmetic on price levels only, spread and commission play no part in reading a shape, they only matter once it becomes an actual trade.
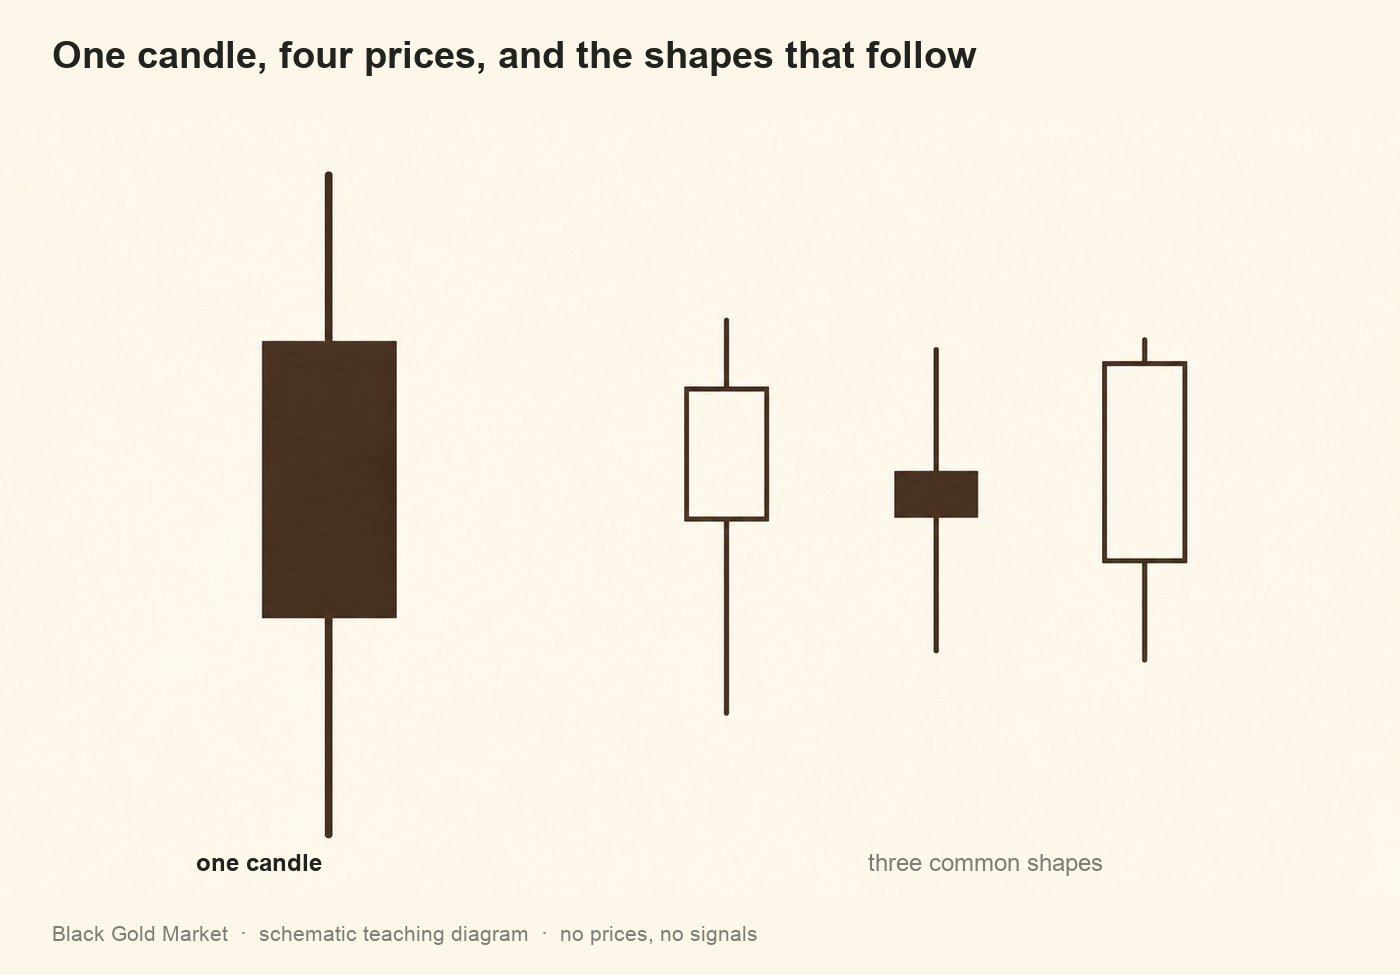
Three shapes worth knowing
| Shape | What happened in the interval | What it suggests about control | What it does not tell you |
|---|---|---|---|
| Long lower wick | Fell sharply, bought back before the close | Sellers pushed down, buyers defended it | Whether buyers stay in control next |
| Narrow body inside the prior range | Open and close stayed inside the previous candle's range | Neither side pushed forward, the market is pausing | Which way the pause resolves |
| Strong close near the high | Pushed up, finished near the top of its range | Buyers still pressing right up to the close | Whether that pressure carries forward |
Where people go wrong
Naming a shape and calling it a plan. Someone spots a long lower wick, says "that's a hammer, buy," with no invalidation level or size decided in advance. One wrong read then costs far more than it should, because nothing capped it.
Giving a five minute candle the weight of a daily one. A shape built from a thin handful of trades gets read as if it carries a full day's evidence. The result is reacting to noise, then wondering why the "signal" reversed an hour later.
Trading the wick on a close based rule. Price pokes through a level mid candle, the trader jumps in, and the candle closes back on the other side. The entry was taken on data that had not finished forming.
Your turn
- Pick a daily candle and a five minute candle, same instrument, same day. Write down open, high, low and close for each, then compute the body and both wicks using subtraction only.
- For each, decide whether it matches a long lower wick, a narrow body inside the prior range, a strong close near the high, or none of these, before looking at what happened next.
- Wait for the following candle to close on each timeframe, then write one sentence on what actually happened, kept separate from your guess.
Check yourself
What is the difference between a candle's body and its wick?
The body is the distance between open and close, where the interval settled. The wick marks the high and low reached but not held onto by the close.
Why can the same candle shape mean different things on different charts?
Meaning depends on where a candle sits and how much participation built it, not just its shape. A wick after weeks of decline is different evidence from the same wick inside a stalled range.
Why do many rule based traders wait for the close rather than react to a wick forming mid candle?
The close is the finished decision for that interval, while a high or low reached partway through can reverse before the candle finishes, so it has not settled yet.
A single candle tells you what happened in one interval. The next lesson looks at what happens once many intervals stack into a level price keeps returning to, in Support, resistance and structure.