
Technical toolkit

You pull up the four hour chart on gold and the RSI line is sitting at seventy eight. Someone in a chat room posts a screenshot with three fire emoji and the word overbought. You trim half your position because the number looks like a warning light. Gold adds another forty dollars an ounce over the next two sessions, without you.
Nothing was broken, the indicator did its job, the read of it was wrong. RSI does not measure how expensive gold is, or how far a move can still run. It measures something narrower, and once you know what that is, the number stops being scary and becomes one more piece of information.
The idea in plain words
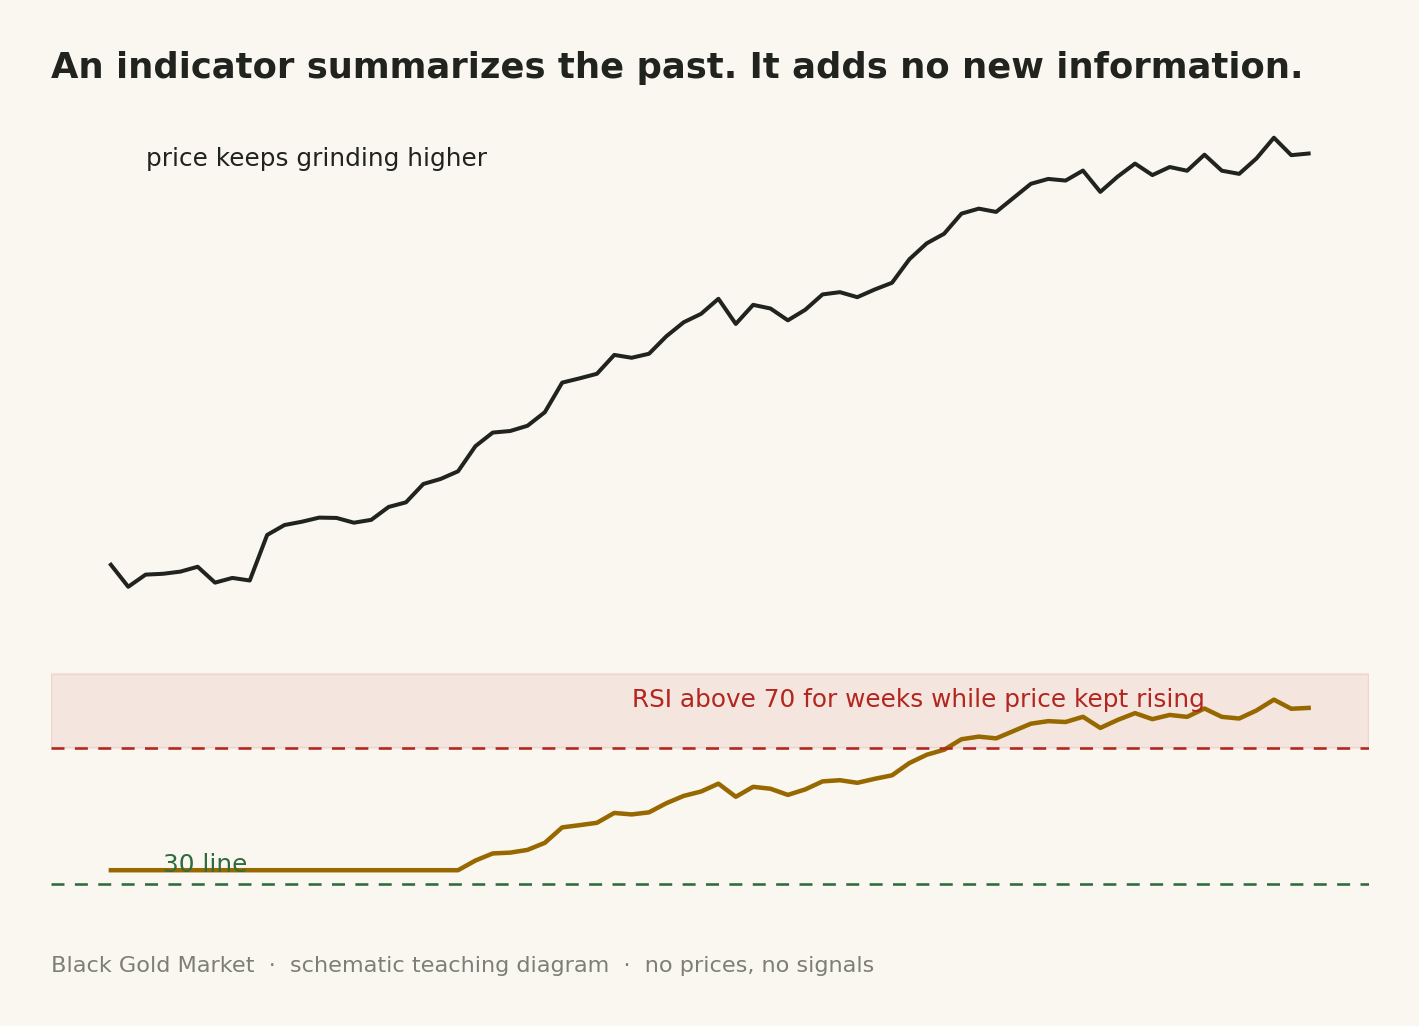
RSI, the Relative Strength Index, sorts each bar over a lookback, fourteen by default, into a gain or a loss, averages the two, and turns the ratio into a number from zero to one hundred. Fifty means gains and losses have run about equal. The seventy and thirty lines mark where one side has clearly dominated, not that a reversal is due. In a strong trend price can post gains for weeks, and RSI simply sits above seventy the whole time, because the math has no opinion on how long a trend runs.
MACD, Moving Average Convergence Divergence, is simpler than it sounds. A fast moving average of price, usually twelve periods, minus a slower one, usually twenty six, gives the MACD line. A third average, nine periods, drawn over that line, is the signal line. When the two cross, momentum has flipped. Both lines are moving averages, backward looking by nature, so MACD inherits that lag. By the time the lines cross, the move that caused it has already happened. The crossover confirms a shift, it does not warn you ahead of one.
Average True Range, ATR, measures something different, the recent size of price movement, not its direction. It takes the true range of each bar, the largest of the high to low distance, the high to the prior close, or the low to the prior close, and averages that over a lookback. A rising ATR means bars have gotten bigger, not which way the next one goes. It earns its place in setting a stop wide enough to survive ordinary noise, and in sizing a position from a loss budget.
All three do the same underlying job, turning past prices into a different shape. None adds information that was not already in the price, they only summarize it in a way that is easier to act on consistently. An indicator will not tell you the future, it applies the same rule to today's chart and to next month's chart without getting tired or hopeful. Its job is to make you consistent, not to make you right.
A worked example
Here is RSI worked from scratch on made up numbers. Say gold closes up eight dollars, down two, up six, up four and down three over five sessions, a hypothetical run, not a real quote. The average gain is eight plus six plus four, divided by five, which is 3.60. The average loss is two plus three, divided by five, which is 1.00. The ratio of the two is 3.60, and running that through the standard rescaling gives an RSI of roughly 78. Three up days out of five produced that reading, and it says nothing about session six.
Now the volatility side. Say five hypothetical daily true ranges for gold came out at eighteen, twenty two, fifteen, twenty six and nineteen dollars per ounce. Add those for one hundred, divide by five, and the five day ATR is twenty dollars per ounce, a description of how big a normal day has been lately.
That number earns its keep in the next two decisions. A stop at one and a half times this ATR sits thirty dollars from entry, wide enough to survive an ordinary day of noise. On a ten thousand dollar account, risking one percent of equity is one hundred dollars. Divide that by the thirty dollar stop and the position size is roughly 3.3 ounces, before spread, commission or financing are added.
Three tools, three jobs
| Tool | What it measures | Good for | What it cannot do |
|---|---|---|---|
| RSI | Average gains versus average losses over a lookback, rescaled zero to one hundred | Gauging whether momentum has been one sided | Predict a reversal |
| MACD | The gap between a fast and a slow moving average, plus a signal line over that gap | Describing when momentum has shifted | Warn you before the shift |
| ATR (Average True Range) | The average size of recent price bars, including gaps | Setting a stop, and sizing a position from a loss budget | Say whether the next move is up or down |
Where people go wrong
Selling the moment RSI crosses seventy. In a genuine trend that reading can hold for weeks. Closing a position on that signal alone means cutting winners short and handing the rest of the move to whoever stayed in.
Chasing the MACD cross after it prints. The lines already lagged the price that produced them, so entering on the cross often means arriving after the bulk of that leg is finished, with worse risk to reward than reading the chart earlier.
Treating a rising ATR as a directional clue. A bigger average true range means bars are getting larger, not that they are more likely to go up. Sizing should adjust with it, direction does not follow from it.
Your turn
- On a demo chart of gold, add RSI with the default fourteen period setting, mark the last ten times it crossed above seventy, and note whether price kept climbing afterward or turned down.
- Add MACD with twelve, twenty six and nine as the settings. Find the three most recent crosses of the MACD line and its signal line, and count how many bars had passed since the swing high or low that produced the cross.
- Using the highs, lows and closes on your platform, calculate a five day Average True Range by hand for gold, the way it was done above, then set a hypothetical stop at one and a half times that number.
Check yourself
What two numbers does RSI actually compare?
The average size of recent gains against the average size of recent losses, rescaled onto a zero to one hundred scale.
Why does MACD lag the price it is drawn from?
Both its lines are moving averages, a backward looking calculation. By the time the lines cross, the move that caused it has already been partly completed.
Can Average True Range tell you which way price will move next?
No. It measures how large recent price bars have been, useful for a stop and a position size, not a direction.
None of these three tools tell you what a level on the chart will do once price gets there. That is the next piece, fixed reference points built from a swing or a prior session, covered in Fibonacci and pivot levels.