
Technical toolkit

Someone in a group chat posts a screenshot with three trend lines and the word "triangle" written in red. Price has been chopping sideways for two days, and the message says a breakout is coming. Nobody says which way. The picture looks convincing anyway, so you sit and wait for something to happen.
A few candles later somebody else posts a different picture. The price line stretches to a new high while a smaller line underneath it, the indicator, makes a lower high. They call it divergence and say the move is running out of steam. Two pictures, two stories, and neither tells you where you would put a stop before you ever click buy or sell.
The idea in plain words
A chart pattern is a name for a shape price makes while it pauses or turns, nothing more. It gives traders shared language, so "triangle" means the same thing to any two people looking at it. That is useful. It is not a forecast, and plenty of clean-looking shapes fail anyway.
Three shapes show up often enough to know well. A range is price bouncing between a repeated ceiling and floor, going nowhere for a while. A triangle is a range that is tightening, the ceiling sliding down or the floor rising until the space runs out. A flag is a short, mild pullback sloping against a sharp prior move.
When one of these resolves with a breakout, traders often measure the pattern's height and project that distance from the breakout point for a rough target, a measured move. It is popular because it is simple, not because it is reliable. Price can stall well short of it, blow through it, or reverse first. Treat it as an old rule of thumb, not a rule of physics.
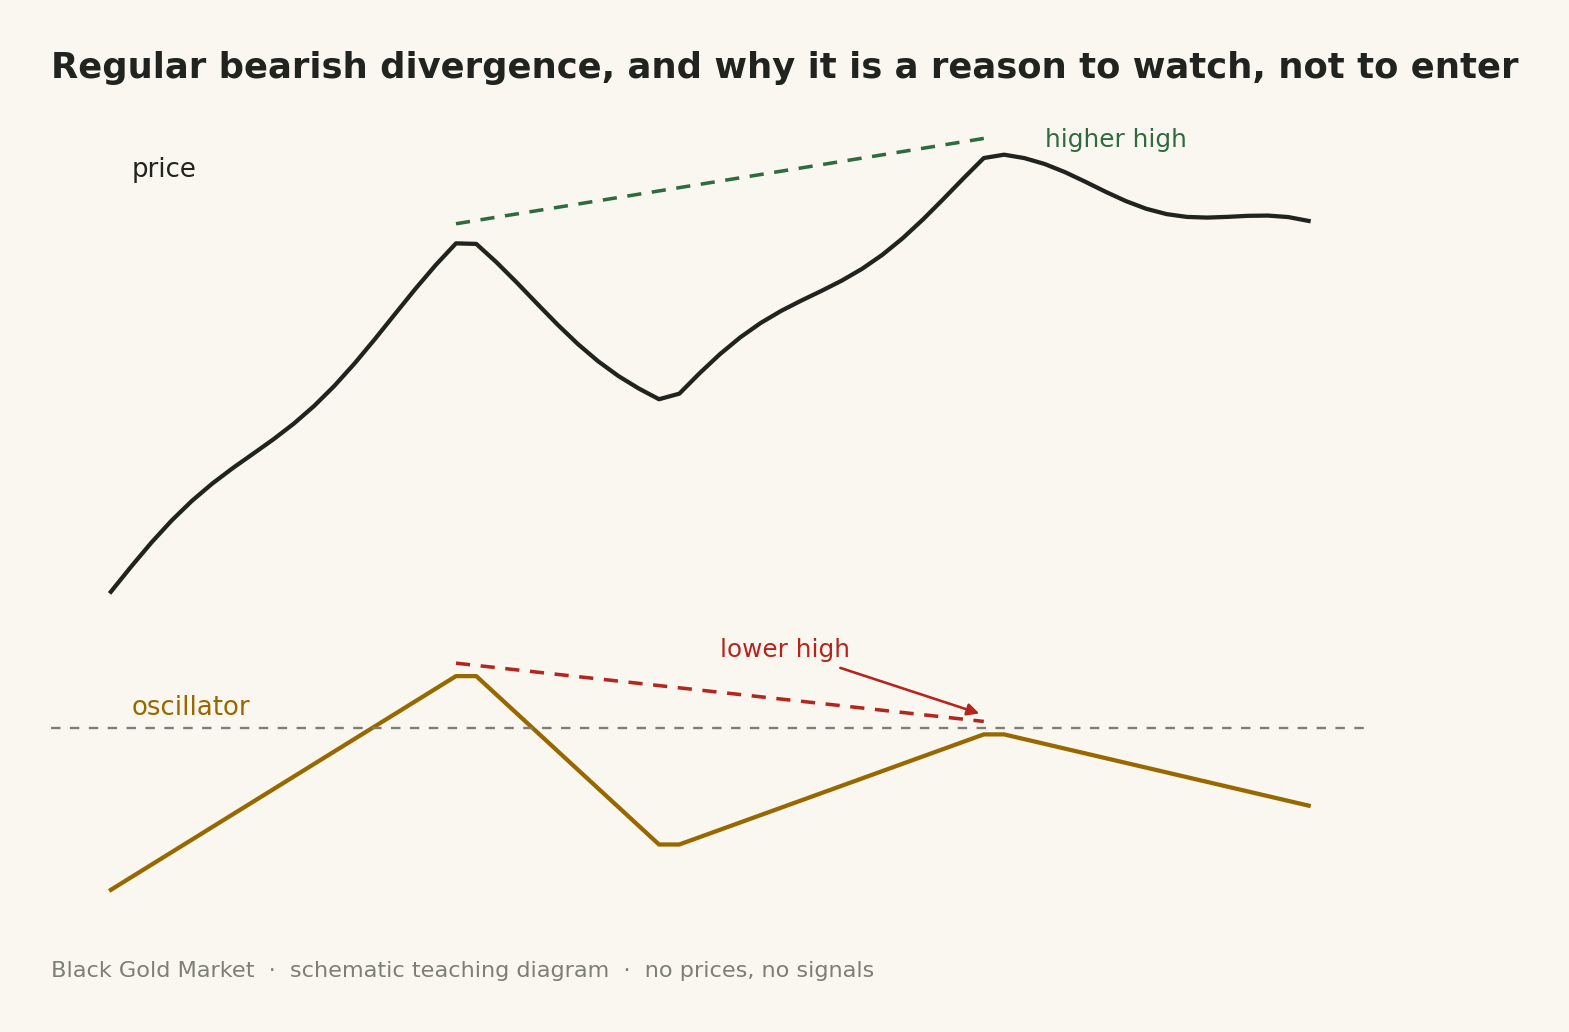
Divergence compares price against an oscillator, of the kind covered in RSI, MACD and volatility. In regular divergence, price prints a higher high while the oscillator prints a lower high, momentum fading even as price climbs (a lower low against a higher low is the same idea, mirrored). In hidden divergence the roles swap, price sets a shallower swing while the oscillator sets a deeper one, read as the existing trend gathering itself rather than ending. The part most people skip is that divergence can appear early and sit there through a long stretch of a strong trend, a reason to watch more closely, not a countdown. Neither a pattern nor a divergence reading is ever a reason to enter alone. Each still needs a level that says, plainly, when the idea was wrong.
A worked example
Measuring a range breakout (hypothetical)
Say a hypothetical instrument holds a range with a ceiling at 42.00 and a floor at 38.00. The height is 42.00 minus 38.00, or 4.00. Price closes above 42.00. A measured move adds that 4.00 onto the breakout point, giving 46.00, a distance to watch, not a promise, and it says nothing about spread, commission or timing.
Reading divergence on a chart (hypothetical)
Suppose price makes a swing high at 44.00 while an oscillator reads 68 at that moment. Two weeks later price makes a second swing high at 46.00, clearly above 44.00. At that second high the oscillator reads only 61, a step down from 68.
Price made a higher high, 46.00 above 44.00. The oscillator made a lower high, 61 below 68. Higher high in price plus lower high in the oscillator is the definition of regular divergence. It does not say the next candle turns down, only that the climb is not confirmed by the force that drove the earlier one.
Three patterns compared
| Pattern | What it looks like | What it suggests | What invalidates it |
|---|---|---|---|
| Range | Price bounces between a repeated ceiling and floor | Buyers and sellers are roughly balanced at these two levels | A close through either boundary that holds, not just a single wick beyond it |
| Triangle | A range that narrows, the ceiling and floor converging | The pause is running out of room and a decision is close | Price stalling inside the triangle for far longer than the earlier swings, or breaking out and immediately snapping back inside |
| Flag | A brief, gentle pullback tilted against a sharp prior move | The market is pausing rather than reversing after a strong push | The pullback growing deeper or longer than the move that preceded it |
Where people go wrong
Drawing the pattern after price already moved. It is easy to trace a perfect triangle onto a chart that already broke out. The result is a private highlight reel of shapes that "worked," while every messy shape that failed gets quietly ignored, building false confidence in an untested edge.
Trading a divergence signal the moment it appears, inside a strong trend. Because divergence can persist for a long stretch, jumping in on the first sighting means fighting a trend still making new highs or lows. The result is a string of positions stopped out one after another, each entered on the same early warning.
Skipping the invalidation level. A pattern or divergence reading is only half a plan without a price that proves it wrong. When the breakout fails, a trader with no line drawn in advance cannot decide whether to exit or hold.
Your turn
- On a demo account or on paper, mark the last three ranges, triangles or flags on a chart you watch. Write down the height of each and calculate its measured move by hand.
- Add an oscillator from the RSI, MACD and volatility lesson to the same chart. Find one place where price set a new high or low the oscillator did not confirm, and label it regular or hidden divergence.
- For each pattern and the divergence example, write the exact price that would prove the idea wrong, before you would ever consider a live trade.
- Keep a running note for a week of how many ideas followed through versus how many failed, so the failures stay in the record.
Check yourself
What does it mean when a pattern is called a description rather than a prediction?
The name only records that price made a recognizable shape in the past, not that the textbook outcome must follow.
Why can divergence show up on a chart for a long time before price actually turns?
Momentum can stay weak while a strong trend keeps grinding to new highs or lows, so early divergence is a signal to watch more closely, not a countdown.
What is the difference between regular and hidden divergence, in one sentence each?
Regular divergence is price setting a new extreme the oscillator does not confirm, read as the move losing force. Hidden divergence is the oscillator setting a new extreme price does not match, read as the trend continuing.
A pattern or a divergence reading usually gets settled one way, price pushes through the boundary you were watching, for real or only briefly. The next lesson covers breakouts and false breaks, including how to tell a genuine move from one that snaps back before your invalidation level is even tested.