

Most of the time a barrel of oil, a bushel of wheat or an ounce of gold costs more for delivery next year than for delivery today, and there is a dull, sensible reason for it. Occasionally that flips, and the market will pay more for the thing now than for a promise of the thing later. So let us answer it properly: what is backwardation in gold, how would you know it was happening, and what does it actually tell you that the price chart does not?
I am going to do this the way I do everything in this journal. The interest rate figures come from the Federal Reserve's own weekly release. What the London market publishes, and what it does not, comes from the LBMA's own data page. The arithmetic on top of those is mine and I show it. There is no gold price anywhere in this article, because the shape of the curve is a separate question from the level of the price, and the whole value of the topic lies in keeping those two apart.
What is backwardation in gold, stated plainly
Backwardation is when the price for delivery later is lower than the price for delivery now. The curve slopes down. Its opposite, and the normal condition for gold, is contango, where later delivery costs more and the curve slopes up.
The word describes the shape of a curve, not a direction of travel. A market in backwardation can be rising or falling. What the shape tells you is something about the balance between people who want metal now and people who are happy to wait, and in gold that balance is usually so comfortable that the curve almost never inverts. When it does, it is worth knowing why.
The carry line, and why a forward normally costs more
Start with why contango is the default, because backwardation only means something against that baseline.
If you want an ounce of gold in twelve months, you have two routes. You can agree a forward price now and pay then. Or you can buy the metal today, borrow the money to do it, and hold the bar for a year. The second route costs you the interest on the money for twelve months, plus storage and insurance. So the forward price should sit above the spot price by roughly that cost, otherwise one route is free money against the other.
That is the cost of carry, and it needs a real interest rate to be worth anything. The Federal Reserve H.15 release dated 19 October 2026 puts the federal funds effective rate at 3.88 per cent for every business day from 12 to 16 October 2026, and the three month Treasury bill in the secondary market at 4.08 per cent. Those are published figures, not estimates of mine.
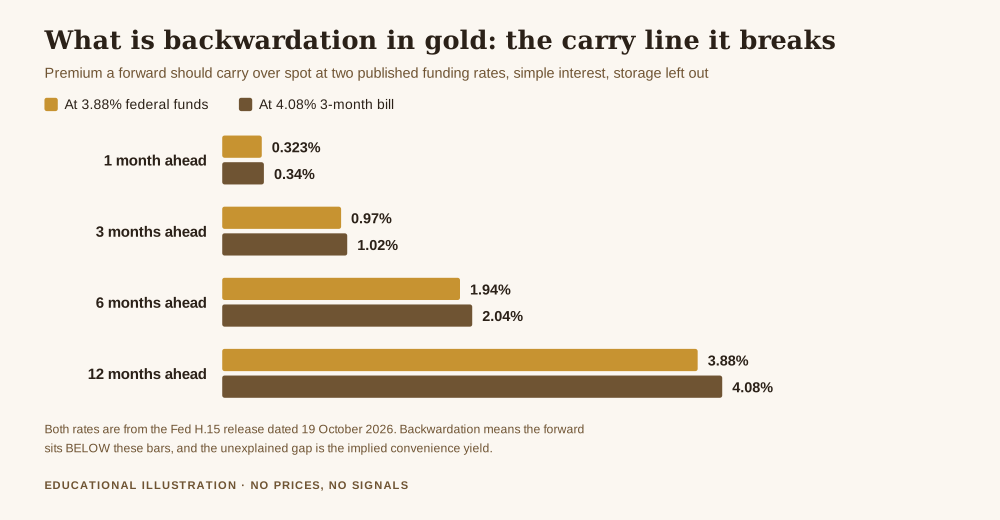
Run the arithmetic across the curve, as simple interest, with storage and insurance left out and said so. At the 3.88 per cent funds rate, one month of carry is 0.323 per cent, three months is 0.970 per cent, six months is 1.940 per cent and twelve months is 3.880 per cent. At the 4.08 per cent bill rate the same tenors give 0.340, 1.020, 2.040 and 4.080 per cent.
Those bars are the line. A gold forward curve that slopes up by roughly that much is not telling you anything except that interest rates exist. It is the market working normally.
What backwardation implies, and the word for it
Now invert it. If the three month forward trades below spot rather than about one per cent above it, the carry model has failed by the whole distance between them. Somebody is choosing to hold metal today and forgo close to four per cent a year in interest, and still not selling it forward. That is not irrational. It means having the metal in hand is worth something to them beyond its price.
Economists call that extra something the convenience yield, and you can put a number on it. Take the funding rate and add back whatever discount the forward shows against spot, annualised for the tenor. The arithmetic for three months is the funding rate plus four times the discount.
Work through it. If the curve is merely flat, the forward equal to spot, the implied convenience yield is already 3.88 per cent, the entire funding rate. A three month forward a quarter of a per cent below spot implies 4.88 per cent. Half a per cent below implies 5.88 per cent. A full one per cent below implies 7.88 per cent, which is 2.03 times the funding rate.
That is the real content of the word. Backwardation in gold is the market quoting you a price for immediacy, and the deeper the backwardation the more immediacy is worth. It is the same instinct that makes somebody pay more for a flight leaving tonight than one leaving in March.
Why you cannot simply look the gold curve up
Here is the part that frustrates people, and I would rather say it plainly than pretend otherwise. There is no public benchmark for the gold forward curve that you can check the way you check an interest rate.
The LBMA's public prices and data page lists what the London market publishes: the LBMA Gold Price, set twice daily in auctions at 10:30 and 15:00 London time, the Silver Price at noon, the platinum and palladium auctions, and separate series for trade reporting, clearing and London vault data. A forward rate benchmark is not among them, and the historical price tables now sit behind a licensed portal rather than in the open.
What you can see instead is the futures market. The exchange traded contract has a settlement price for each delivery month, and the relationship between the near month and the ones behind it is a public, observable curve. That is the practical route for a retail trader, and it is why the gap between the COMEX and spot gold price is worth understanding before you try to read any of this. The lending side of the same market, where metal is borrowed rather than bought, is covered in gold leasing explained, and the two are closely related: a sharp rise in what it costs to borrow metal and a curve tipping into backwardation are usually the same event described from two directions.
What actually causes it
Gold is unusual among commodities because almost all of it ever mined still exists. There are tens of thousands of tonnes sitting in vaults, most of it owned by people who could lend it out if the price of doing so rose. That enormous above ground stock is exactly why gold sits in contango nearly all the time. The supply of metal available to lend is vast compared with the quantity anybody needs in a hurry.
So when the curve does invert, it is rarely about mine production, which moves a per cent or two a year and is published long after the fact. It is about the metal being in the wrong place, in the wrong form, or in hands that will not release it. Metal shipped to one vault to satisfy one exchange's delivery rules is not available in another city that afternoon. Refining capacity to turn one bar size into another is finite. Large holders deciding they would rather hold than lend removes supply from the lending market without changing a single reserve figure.
The holders who matter most here are official ones, and the reference series on their holdings is maintained by the World Gold Council from the International Monetary Fund's International Financial Statistics. Its current edition was published on 6 October 2026 using the September 2026 statistics, with holdings dated 30 June 2026 for most reporting countries. Their behaviour as lenders, covered in how central banks affect the price of gold, changes the availability of metal far faster than any mine can.
What it means if you trade XAU/USD rather than store bars
Honestly, on a trading timeframe, not much directly, and I would rather tell you that than inflate the topic.
You are not taking delivery. You hold a contract for difference or a spot position financed overnight, and the curve reaches you only through the financing charge applied to that position, which is the subject of the swap rate on your statement. If the cost of carrying gold shifts, your overnight charge shifts with it, and that is a cost line rather than a signal. The arithmetic for how a funding rate turns into a position cost is the same arithmetic as how interest rates affect the price of gold, applied to your account instead of to a vault.
What backwardation is genuinely useful for is context. It tells you that the physical market is tight, which tends to coincide with the kind of session where spreads widen, where moves run further than the news seems to justify, and where a position sized for a calm week behaves badly. That is a risk input, not an entry. The sensible response to it is the same as the sensible response to any rise in volatility, and it lives in how to protect your capital when gold gets volatile.
What this article does not say
It does not say backwardation predicts the gold price. It is a statement about the shape of a curve and the cost of immediacy, and the historical relationship between curve shape and subsequent direction is not stable enough to trade from.
It does not give you today's curve, because the forward leg has no public benchmark to give. The percentages in the chart are the carry line computed from published interest rates, and the convenience yield figures are illustrations of the method, not quotes.
And it does not suggest there is an arbitrage here for you. Capturing a carry dislocation means financing, storing and insuring physical metal in approved form. The reason to understand backwardation is that it explains a force acting on the market you do trade, not because there is a position in it for you.
Get the free Black Gold Market blueprint, a short document on protecting capital and on checking a claim against its primary source before you act on it. One email, no spam, unsubscribe anytime.
Get the free blueprint →Frequently asked questions
What is backwardation in gold, in one sentence?
It is when gold for delivery later trades below gold for delivery now, so the forward curve slopes down instead of up.
What is the difference between contango and backwardation?
Contango is the normal state, where later delivery costs more because holding metal costs interest, storage and insurance. Backwardation is the inversion, where the market pays a premium for metal immediately.
How much higher should a gold forward be?
Roughly the funding cost over the period. At the 3.88 per cent federal funds effective rate, simple interest gives 0.323 per cent at one month, 0.970 per cent at three months, 1.940 per cent at six and 3.880 per cent at twelve, before storage and insurance.
What does backwardation tell you about supply?
That metal available right now is scarcer than usual relative to demand for it right now. Because almost all gold ever mined still exists, this is nearly always about location, form or the willingness of large holders to lend, rather than about mine output.
How do I check whether gold is in backwardation?
Compare the settlement prices of successive futures delivery months on the exchange. You cannot do it from London forward rates, because the LBMA publishes auction prices plus trade, clearing and vault data, and no public forward benchmark.
Does backwardation mean I should buy gold?
No. It is a description of the cost of immediacy in the physical market, not a directional view, and it reaches a leveraged retail position only as a change in the overnight financing charge.
Where Black Gold Market fits
Black Gold Market is a free journal about reading gold and protecting capital, written for people who would rather check a primary source than be told what to think. Nothing here is sold on a promise of returns and there is no signal service. The free blueprint is a short document on protecting capital and on the unglamorous checks that decide whether a claim holds up. The piece underneath all of it is how to protect your capital when gold gets volatile, and two companions to this one are what COMEX gold is and what swap charges are in forex.
About the author. Raphael writes Black Gold Market. He went looking for a chart of the gold forward curve one morning, discovered the benchmark behind most of them stopped being published in the open years ago, and decided the more useful article was the arithmetic you can do without it. What matters to him is the level, the context, and the risk, in that order.
This article is educational and is not financial advice. Trading gold and other leveraged products carries a high risk of losing money rapidly, and no entry, stop or target discussed should be treated as a signal. The federal funds effective rate of 3.88 per cent and the three month Treasury bill rate of 4.08 per cent, both for 12 to 16 October 2026, are from the Federal Reserve H.15 release dated 19 October 2026, linked above. The list of what the LBMA publishes publicly, including the twice daily gold auctions at 10:30 and 15:00 London time, the noon silver auction, the trade reporting, clearing and vault series, and the absence of any forward rate benchmark, is from the LBMA prices and data page, linked above. The publication date of 6 October 2026 for official gold holdings, compiled from the September 2026 edition of the International Monetary Fund's International Financial Statistics with holdings dated 30 June 2026, is from the World Gold Council's gold reserves by country page. All three pages were retrieved and read before publication. The carry premiums of 0.323, 0.970, 1.940 and 3.880 per cent at the funds rate, the matching 0.340, 1.020, 2.040 and 4.080 per cent at the bill rate, and the implied convenience yields of 3.88, 4.88, 5.88 and 7.88 per cent, are my own simple interest arithmetic on those published rates, with storage and insurance excluded and the forward discounts chosen as illustrations rather than quoted from any market. No gold price is quoted anywhere in this article. Decide your own risk, and never trade money you cannot afford to lose.