
Chart foundations

You put a moving average on a chart because everyone else has one. It looks tidy, sloping up in an uptrend and down in a downtrend, and for a while it feels like it is reading your mind.
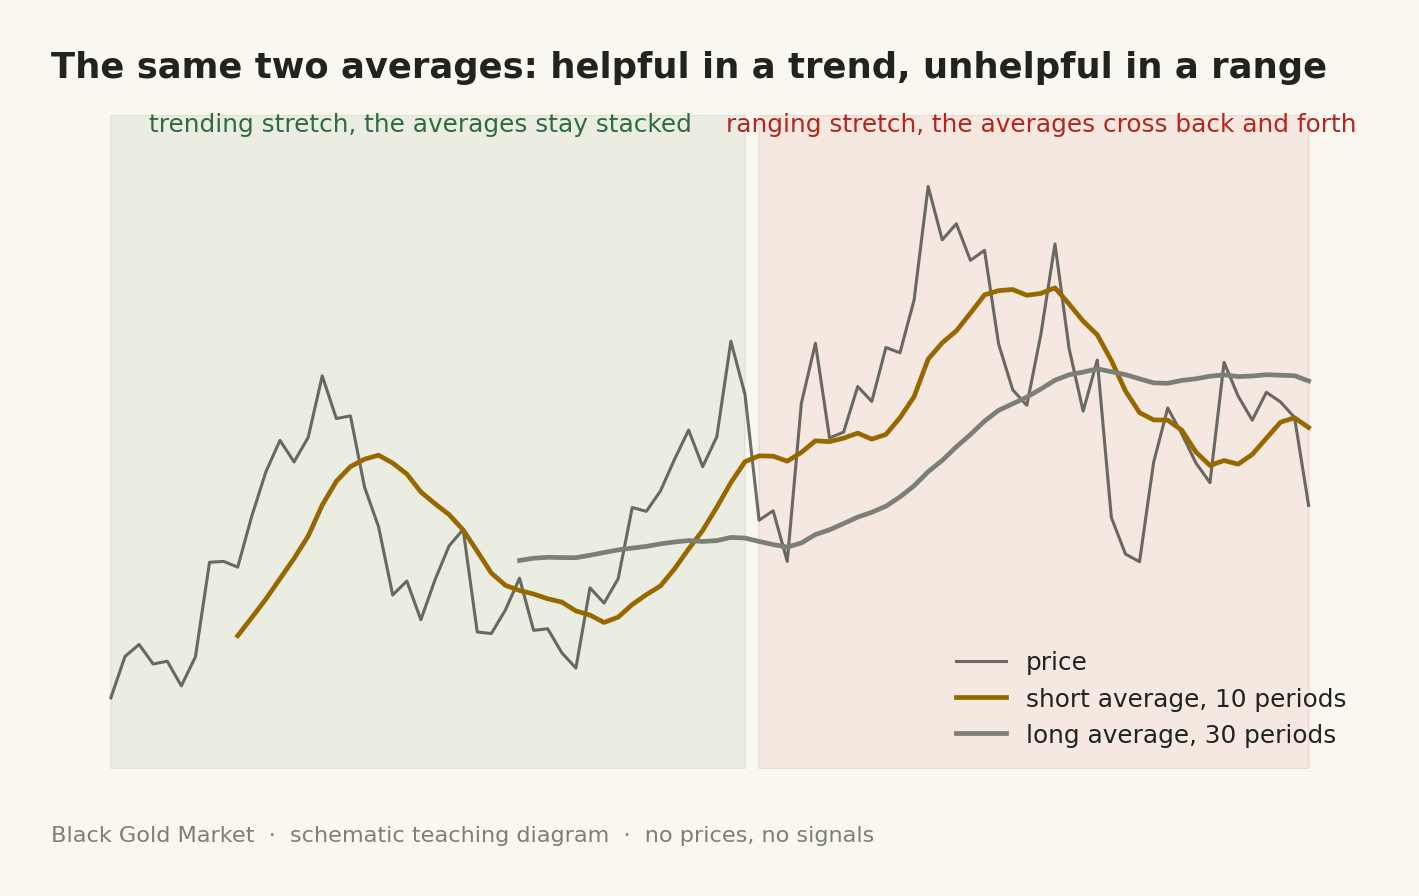
Then price stalls and drifts sideways for a couple of weeks. The same line that felt so reliable starts crossing back and forth like a cat deciding whether to go outside. Every crossing screams trade, and every trade after it loses a little more.
The idea in plain words
A moving average is arithmetic, not analysis. Take the last N closing prices, add them up, divide by N, and plot the result next to price. As a new candle closes, the oldest price in the window drops off and the newest one joins it, so the line moves forward one close at a time. There is no opinion inside it, no view on supply or demand, just a running average of price already printed.
A simple moving average, SMA, weighs every close in its window the same, a close from twenty candles back counts as much as the close from one candle back. An exponential moving average, EMA, weighs recent closes more, so it reacts to a fresh move faster than an SMA of the same length. That gap matters most when price changes pace. In a slow, steady trend the two lines sit close together and the choice barely matters.
The length you choose is a trade off, not a setting to tune until it looks perfect on the last six months. A short lookback, say ten candles, hugs price closely and turns quickly when a trend changes, but it also turns on every small wiggle, whipping you back and forth. A long lookback, say fifty or two hundred candles, ignores the small wiggles and only turns when a trend genuinely changes character, but by then a large part of the move is already behind you. Faster is not better and slower is not safer. Pick a length based on how much noise you can tolerate, then hold it across many trades instead of changing it after every loss.
The steadiest use is as a filter, not a trigger. A filter answers one question, is the market biased up, biased down, or not clearly biased, from where price sits against the line and which way it slopes. It does not tell you where to enter, where to stop out, or when to take profit, those need their own rules. Turning the line into an entry signal, buy on a cross above it, sell on a cross below it, is where the trouble starts. On a finished chart the one crossing that caught a whole trend looks brilliant, hindsight hides the failed crossings that came before it, and in a range price crosses the average constantly, each false one costing spread or commission for nothing. There is also a plain arithmetic fact, a moving average always lags, built from closes that already happened, so it describes where the market has been, never where it is going. A longer lookback lags more, a shorter one lags less, and no length removes the lag.
A worked example
Here is a hypothetical set of six closing prices for an imaginary instrument, not a real gold price. In order, 100, 102, 98, 104, 101, then a new close of 106 arrives.
Find the 5 period SMA after the first five closes by adding them and dividing by five. 100 + 102 + 98 + 104 + 101 = 505, and 505 divided by 5 = 101, the SMA.
Now the sixth close prints, 106. The window stays five closes wide, so the oldest close, 100, drops out and 106 joins it, giving 102, 98, 104, 101, 106. That adds to 511, and 511 divided by 5 = 102.2.
The average moved from 101 to 102.2 because an old close left the window the same moment a new one entered it. That is the whole mechanism behind every moving average, a rolling window, not a memory of everything that ever happened.
Simple versus exponential, at a glance
| Trait | Simple moving average | Exponential moving average |
|---|---|---|
| How it weighs each close | Every close counts equally | Recent closes count more |
| Reaction to a sudden move | Slower, waits for the old close to drop out | Faster, shifts right away |
| Best suited to | A smoother read of the larger trend | A market changing pace |
| Hand calculation | Simple addition and division | Needs a smoothing constant |
Where people go wrong
Trading every crossover as an entry. A crossover can flag a real shift in a genuine trend, but in a range price wanders back and forth across the same line all week, and each crossing looks identical to a good one as it happens. A trader who buys and sells on every cross pays spread or commission on small losses before ever seeing the payoff remembered from the one time it worked.
Shortening the lookback after getting whipsawed. A trader who gets stopped out cuts the period from twenty to ten, hoping to catch the next turn sooner. A shorter average reacts faster, but also reacts to more noise, so the fix usually produces more, smaller false signals. It fits a rule to the last loss, not to the future.
Treating the line as a forecast. A moving average is built only from closes that already happened, so it cannot see the next candle. Reading its slope as a prediction of tomorrow credits it with knowledge it does not have.
Your turn
- On a demo account or on paper, put a 10 period and a 50 period SMA on one chart.
- Find one clean trending stretch and count the crossings there.
- Find one sideways stretch of at least a week and count the crossings there too.
- Note what the 10 period average did at each crossing that the 50 period did not.
- Pick five made up closes, calculate a 5 period SMA by hand, then add a sixth close and recalculate it as the worked example does.
Check yourself
What does a moving average actually calculate
It adds a fixed number of past closes, divides by that number, then repeats as each new close replaces the oldest one. A running average of price already printed, nothing more.
Why does a longer lookback lag more than a shorter one
A longer lookback needs more old prices to shift, so one new close moves it only a little. A shorter lookback holds fewer prices, so each new close carries more weight, though it too is built from the past.
Why can a crossover look convincing after the fact but fail live in a range
A finished chart only shows the crossing that led somewhere, not the string that went nowhere. In a range, price oscillates around both averages, so most crossings are false, each looking like a good one the moment it happens.
A moving average tells you whether the market is biased in a direction. It says nothing about how strong that bias is, which is the gap the next lesson, RSI, MACD and volatility, starts to close.