
Macro fundamentals

You are watching a trade go nowhere on a quiet Thursday, and then Friday morning it is like someone flipped a switch. Gold jumps thirty dollars in two minutes with nothing new on the chart to explain it. You check the calendar and there it is, a jobs report just landed.
That report did not appear out of nowhere. It was scheduled weeks in advance, and most desks had already guessed roughly what it would say. Price did not move because the number was big or small. It moved because of the gap between what the number said and what everyone had already priced in.
The idea in plain words
A macro trader watches three families of scheduled data. Inflation tracks how fast living costs are rising. Jobs tracks how many people work and what they are paid. Growth tracks whether the economy is producing more or less. Each one feeds the same question a central bank keeps asking, is the economy hot enough to raise the cost of borrowing, cool enough to lower it, or steady enough to leave alone.
Inflation, headline against core
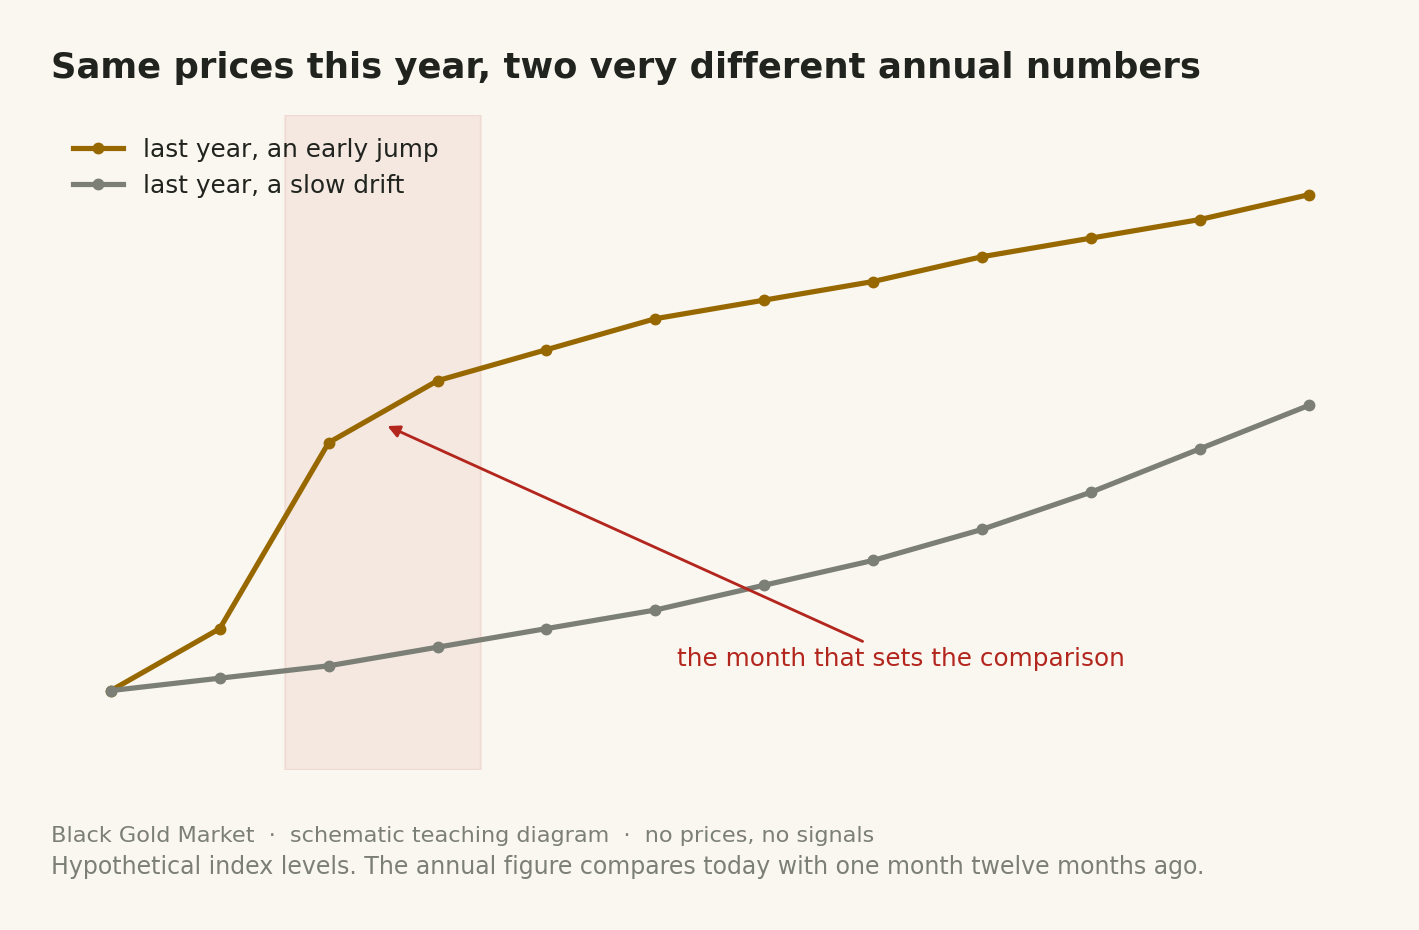
The main inflation report prices a broad basket of goods and services against an earlier period. Headline includes everything, food and energy included. Core strips those two out, since a cold snap or an oil spike moves them for reasons unrelated to demand, so central banks lean on core for policy. The report is shown month on month, the pace right now, and year on year, the level against twelve months back. Year on year carries a base effect, a low comparison month inflates this year's figure with nothing unusual happening now, and a high one flatters it the same way in reverse.
Jobs, the count and the rate
The main jobs report has three moving parts, the payroll count of net new jobs, the unemployment rate from a separate household survey, and wage growth, since faster pay can feed future inflation. Beginners skip a fourth part, revisions. Each new report also revises the prior month or two, sometimes sharply, so a strong headline next to a large downward revision can mean the trend is softening. Reading only the newest number is reading half the story.
Growth, output against opinion
Output data, chiefly gross domestic product, measures what the economy actually produced. It is a hard number but a slow one, released roughly quarterly and revised afterward. Sentiment surveys, such as a purchasing managers index or consumer confidence, ask people how they feel about conditions, arriving monthly and faster, but a survey of opinion is not a measure of activity, people can feel pessimistic and keep spending, or confident right before conditions turn.
None of these numbers matter alone. What moves price is the gap between what got printed and what the market had priced in, the forecast. A number that lands as expected barely moves the market, since positioning assumed it, while a surprise forces a rethink of interest rates next, a chain covered in interest rates and expectations.
A worked example
How a base effect flatters the annual number
The figures below are hypothetical, not a real report. Take a price index climbing steadily at about 0.3 percent a month for over a year, with one exception, a one off energy drop that pulled it lower for a single month twelve months ago.
- This month, index 114.0, last month 113.6. Month on month, (114.0 minus 113.6) divided by 113.6, is 0.35 percent, an ordinary pace.
- Twelve months ago this month, the energy drop month, index was a low 110.5. Year on year, (114.0 minus 110.5) divided by 110.5, is 3.17 percent.
- Thirteen months ago, a normal month, index was 112.0, giving last month's year on year, (113.6 minus 112.0) divided by 112.0, of 1.43 percent.
The annual rate leaps from 1.43 to 3.17 percent in one month, though the month on month pace barely moved. That leap is almost entirely the base effect, a low comparison month dropping out for an ordinary one.
A miss against the forecast
Say the forecast for wage growth this month is 0.3 percent and the actual is 0.1 percent. Wages still rose, 0.1 percent is positive on its own, but against what desks priced in, this is a miss of 0.2 percentage points, and that gap, not the raw figure, is usually what moves gold and the dollar in the minutes after release.
Three data families at a glance
| Family | What it measures | Usual release rhythm | What it tends to say about rates |
|---|---|---|---|
| Inflation | Pace of price rises across a broad basket, headline and core | Monthly, a few weeks after month end | High or rising core argues for higher rates, cooling core argues for cuts |
| Jobs | New jobs added, share out of work, and pay growth | Monthly, often the first Friday, with revisions to prior months | A strong labor market with fast pay growth argues for higher rates, weakness argues for cuts |
| Growth | Output actually produced, plus surveys of business and consumer sentiment | Output quarterly, sentiment surveys monthly | Strong growth with high inflation argues for higher rates, weak growth argues for cuts even before inflation is tamed |
Where people go wrong
Trading the size of the number instead of the surprise. A modest jobs print can move price hard if it missed a much higher forecast, so rates are repricing while the headline looks unremarkable.
Reading the year on year figure as today's story. A rate that falls only because a high comparison month dropped out reads as cooling, then swings back next release, catching the same trader twice.
Ignoring revisions to the prior month's jobs data. Trading only the new headline while last month gets revised down hard means trading a story the data no longer supports.
Your turn
- Open an economic calendar, list next week's inflation, jobs, and growth releases, and note the forecast for each.
- When each releases, record the forecast, the actual, any revision to the prior period, and what gold or the dollar did in the following half hour.
- Find two real inflation index readings a year apart, calculate the year on year change by hand as in the worked example, and compare it with the month on month pace to spot a base effect.
Check yourself
Why do central banks pay more attention to core inflation than headline inflation?
Core strips out food and energy, which swing for reasons unrelated to demand, such as a weather shock or an oil spike, giving a steadier read of the real trend.
A country's year on year inflation jumps from 2 percent to 4 percent in a single month. Did prices rise twice as fast last month?
Not necessarily. Check month on month first. If it moved by its normal amount, the jump is likely a base effect, a low comparison month from a year back, not something unusual now.
Two traders see the same jobs report, showing 150,000 new jobs. One sells gold and the other buys it. Why?
They likely held different forecasts. Against a consensus of 220,000, that print is a miss that can support gold. Against a consensus of 90,000, the same number is a beat that argues the opposite way.
Reading the number is only half the job. Handling the minutes after it hits the wire, when spreads widen and price can spike both ways, is covered next in trading around scheduled news.