
Intermarket context

You are short EUR/USD, short GBP/USD, and long gold, and the account screen shows three separate lines with three separate stop losses. It feels like three chances instead of one. Three tickets are open, three markets are named.
Then a soft US inflation report lands and the dollar falls hard for an hour. The euro rises through your stop, the pound follows a few minutes later, and gold follows soon after. Three trades opened as if they were three separate ideas close as if they were one, because in every way that matters, they were.
The idea in plain words
Correlation is a simple measure of how two things have moved together in the past. Line up the daily moves of two markets, gold and the euro for example, and correlation tells you how consistently they moved in the same direction on the same days. It does not predict what either market will do next. It only describes a pattern in what already happened.
The number sits somewhere between minus one and plus one. Plus one means the two markets moved in the same direction on every day in the sample. Minus one means the opposite, one up whenever the other was down. Zero sits in the middle, and it does not mean the two markets are unrelated in some deep sense. It means that, on the days measured, one told you nothing useful about the other. That is a description of the past, not a promise about tomorrow.
Here is where it catches traders out. EUR/USD, GBP/USD, and gold priced as XAU/USD are all quoted against the US dollar. Each has its own local story too, European growth for the euro, Bank of England policy for the pound, real yields and safe haven demand for gold, a relationship covered in Gold, the dollar and real yields. So the three are never exactly the same trade. But a large part of what moves all three on any given day is one thing, the dollar itself. Open a short euro, a short pound, and a long gold position on the same afternoon because you expect the dollar to weaken, and you have opened one trade on the dollar, spread across three tickets, not three separate trades.
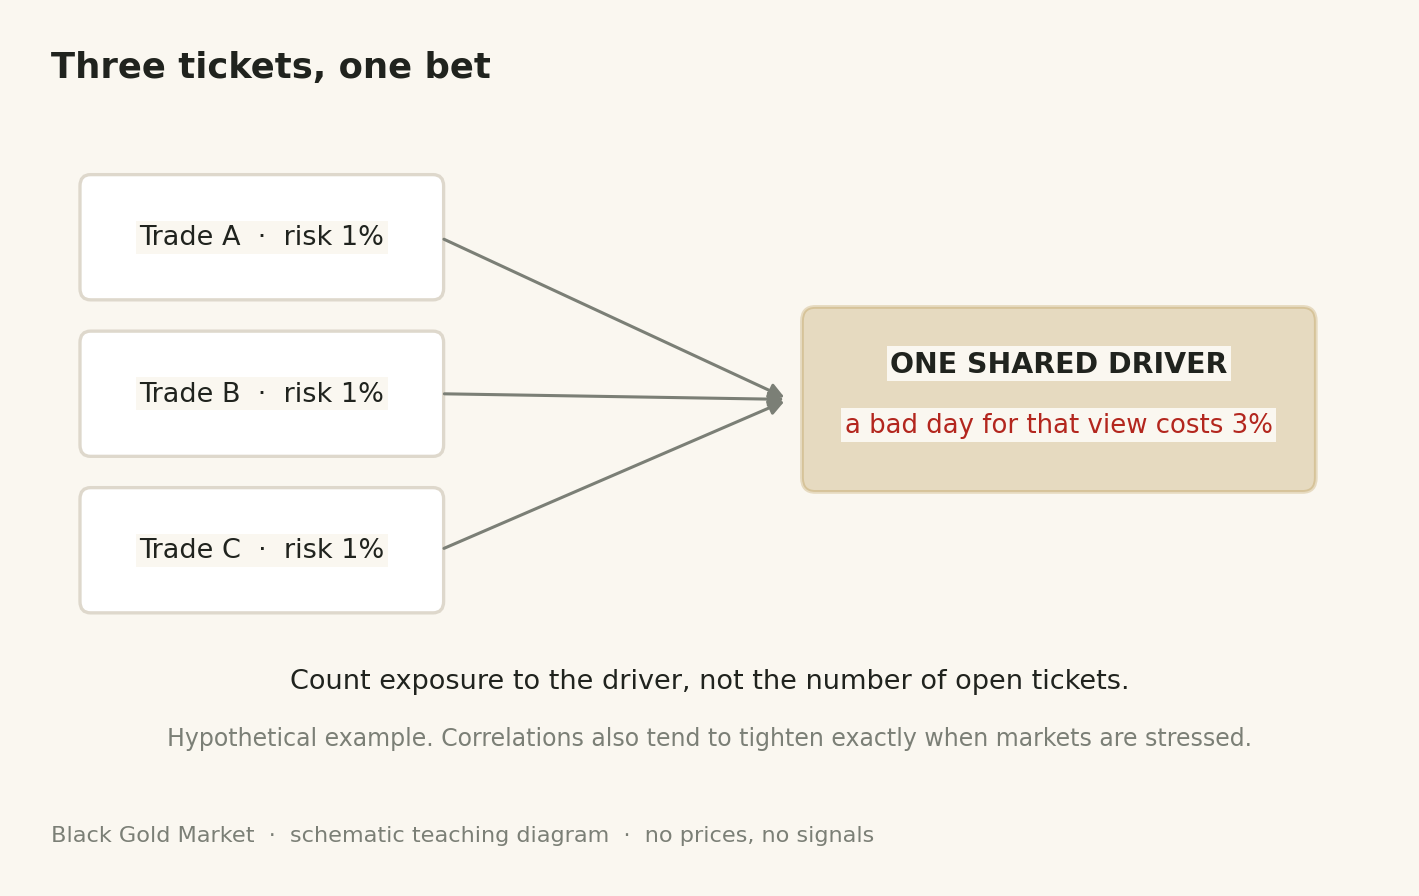
The fix is to stop counting open tickets and start counting exposure to each driver. Before adding a fourth position, ask what it is actually betting on, not what symbol sits in the order box. If a new trade shares its main driver with positions already open, its risk piles onto the risk already sitting there. Three positions each risking 1 percent, sized the way Position sizing from a loss budget describes, are not automatically 3 percent spread three ways. If all three lean on the same driver, they are closer to one position risking 3 percent, wearing three names.
A worked example
Take a hypothetical account of USD 10,000. You open three positions on the same afternoon, all built on one view, that the dollar is about to strengthen. Short EUR/USD, short GBP/USD, and short gold against the dollar, each sized so that if its stop is hit, the loss is 1 percent of the account, USD 100. On paper that reads as 3 percent spread across three markets, a careful, diversified afternoon.
Then the view is wrong. A US inflation report comes in soft and the dollar falls hard within the hour. EUR/USD, then GBP/USD, then gold each rise through their stop within minutes of each other, because all three were reacting to the same dollar move, not three separate stories.
The combined loss is USD 100 plus USD 100 plus USD 100, USD 300, or 3 percent of the account. That number was always going to be 3 percent if all three stops were hit, related or not. What correlation changes is how likely that is. If the three positions had leaned on three different drivers instead, all three stops landing in the same hour would be a rare coincidence. Because all three leaned on one dollar view, all three landing together on one headline is closer to the normal case than the unlucky one. The risk was never three separate 1 percent chances. It was one 3 percent chance wearing three tickets.
Genuinely separate, partly overlapping, or one trade twice
| Position mix | Example | Real number of bets, roughly |
|---|---|---|
| Genuinely separate | Long gold on a real yield view, short USD/JPY on a Bank of Japan view | Close to two, drivers barely overlap |
| Partly overlapping | Short EUR/USD on a growth view, long gold on a safe haven view | Between one and two, share the dollar only |
| One trade in disguise | Short EUR/USD, short GBP/USD, short gold, all on the same dollar strength view | Close to one, sized three times over |
Where people go wrong
Counting tickets instead of exposure. Adding a fourth position because three open trades feel safer than one, without checking whether it shares a driver with the other three. The account is not more diversified, it is more exposed to the one driver already dominating it.
Trusting a calm correlation number. Reading a low correlation from a quiet week and assuming it holds. Correlations tend to climb toward one exactly when a shared shock hits every market at once, the day it matters most.
Sizing against the whole account, not against what is already on the same driver. Risking 1 percent more on a fourth dollar trade because the account has room, without adding it to the 3 percent already sitting on that view.
Your turn
- On a demo account, list every open position with its single biggest driver, a central bank, the dollar broadly, or gold's own safe haven demand.
- Group positions that share a driver and add up the risk in each group, not just on each ticket.
- Find a past day with a large one day dollar move on a chart, and check whether your usual markets moved together that day.
- Before a new position this week, check whether it shares a driver with something already open, and size it down if it does.
Check yourself
If two markets show a correlation of zero, does that mean they can never move together on the same day?
No. A zero correlation is an average over many days, not a rule for any single day. Those two markets can still move together on a day that matters.
Why can three positions each risking 1 percent behave like one position risking 3 percent?
Sizing decides the loss if a stop is hit. Correlation decides how likely all three stops are to be hit together. If they share a driver, they tend to arrive on the same day, so in practice they behave like one 3 percent risk.
Is a correlation measured over the last year safe to plan around?
Treat it as a starting point, not a safe number. Correlations tend to climb toward one during sharp, stressed markets, a worse number than the calm average measured earlier.
Correlation explains how positions move together once a shared driver hits. What decides which way a currency leans over the longer run is covered next in Carry, country risk and sentiment.