

What is gold etf tracking error, in the form the question usually reaches me: you bought a gold fund because you wanted exposure to gold, the metal had a good year, and when you checked the fund it had gone up slightly less. Over a month the difference is invisible. Over twenty years it is not. The useful part of the answer is that for the big physically backed gold trusts, almost the whole gap is one number the fund publishes about itself, and you can check it yourself without trusting anybody's marketing.
So that is what I did for this piece. I took the quarterly and annual reports that the largest gold trust is required to file with the United States Securities and Exchange Commission, pulled out how much metal it held and how many shares were outstanding on five dates between September 2022 and June 2026, and worked out how much gold actually sat behind one share on each of those dates. Then I compared the rate at which that amount shrank against the fee the trust says it charges. The two agree to within a few hundredths of a percentage point. That is the whole story, and it is a more reassuring story than most people expect.
What is gold ETF tracking error, in plain terms
Two different things get called tracking error, and keeping them apart saves a lot of confusion.
Tracking difference is the one you feel. It is simply how far the fund's return falls behind the metal's return over some period. If gold rose 10.0 per cent in a year and the fund rose 9.6 per cent, the tracking difference was 0.4 percentage points. It is usually negative, because running a fund costs money and that money comes out of the fund.
Tracking error, used strictly, is a measure of how much the difference wobbles. It is the standard deviation of the gap, not the gap itself. A fund can have a large tracking difference and almost no tracking error, which is exactly what a well run physically backed gold trust looks like: it falls behind by a very predictable amount, every year, like a slow leak rather than a random one.
Most people typing the question into a search box mean the first thing. They want to know why the fund does not match the metal. So that is what I measure below, and I will come back to the wobble at the end, because for this kind of fund it comes from somewhere else entirely.
The one number that explains nearly all of it
The largest gold trust states the position with unusual clarity in its own filing. The quarterly report covering the period to 30 June 2026 says the trust's "only recurring fixed expense" is the sponsor's fee, and that this fee "accrues daily at an annual rate equal to 0.40% of the daily NAV". In exchange, the sponsor pays the ordinary fees of the trustee and of the custodians who hold the bars.
There are no management salaries layered on top, no trading desk, no performance fee. One charge, stated as a percentage, accruing every day.
The second thing to understand is how the fee gets paid. The trust holds gold and essentially nothing else, so there is no cash pile to pay the bill from. It sells metal. The filing reports a line for gold sold to pay expenses, and for the nine months to 30 June 2026 the sponsor fees came to roughly 456 million dollars, all of it settled by parting with bars.
Put those two facts together and the mechanism falls out. The number of shares does not change when the fee is paid, but the pile of gold behind them gets slightly smaller. So the gold behind one share shrinks, a little every day, at the rate of the fee. That is the tracking difference. It is not a mistake, not slippage, and not the fund failing at its job. It is the price of the job, taken in metal.
Measuring the gap from the trust's own filings
A claim like "the gap is just the fee" is worth very little until somebody measures it. Here is the measurement.
For each filing date I took the ounces of gold the trust reported holding and the number of shares it reported outstanding, then adjusted for the two small balance sheet items that do not belong to shareholders: the fee already accrued but not yet paid to the sponsor, and any gold in transit at the cut off date. What is left is the metal that genuinely stands behind one share.
| Filing date | Ounces held | Shares outstanding | Gold behind one share |
|---|---|---|---|
| 30 Sep 2022 | 30,324,000 | 324,300,000 | 0.093132 oz |
| 30 Sep 2023 | 28,088,000 | 302,700,000 | 0.092760 oz |
| 30 Sep 2024 | 28,033,900 | 303,300,000 | 0.092400 oz |
| 30 Sep 2025 | 32,528,200 | 353,700,000 | 0.092041 oz |
| 30 Jun 2026 | 32,314,200 | 352,000,000 | 0.091770 oz |
Look at the middle two columns and you will see why this needs doing carefully. Between September 2024 and September 2025 the trust's gold pile grew by about 4.5 million ounces and its share count grew by about 50 million shares. A casual glance at "ounces held" would tell you the fund was getting bigger, which it was, and nothing at all about what happened to your slice of it.
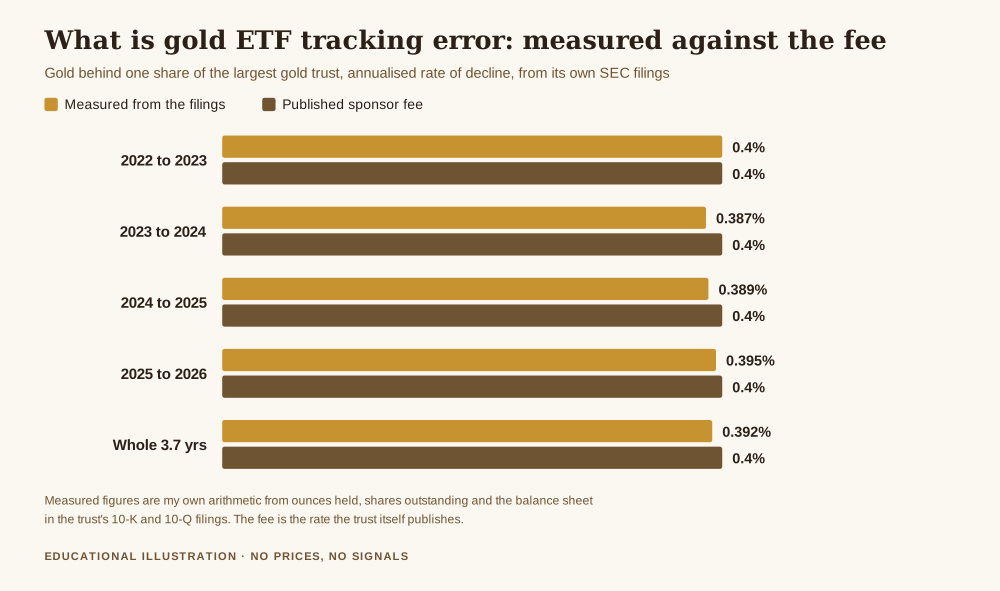
The right hand column is the one that matters, and it only goes one way. Converting each step into an annual rate gives 0.400 per cent, 0.387 per cent, 0.389 per cent and 0.395 per cent. Over the whole three years and nine months, the gold behind one share fell by 1.463 per cent in total, which works out at 0.392 per cent a year.
The published fee is 0.40 per cent a year. The measured decay is 0.392 per cent a year. The gap between the promise and the practice, over nearly four years, is eight thousandths of a percentage point annually.
I want to be honest about one wrinkle, because it is the sort of thing that makes a number look wrong when it is not. If you skip the balance sheet adjustment and just divide raw ounces by raw shares, the year by year figures come out ragged, something like 0.76 per cent one year and 0.50 per cent another. That is not the fee misbehaving. It is gold that was bought or sold near the reporting date and had not yet settled, sitting on the balance sheet as a receivable or a payable. Netting those out is not massaging the data, it is asking the right question: how much metal is actually mine on this date.
Why creations and redemptions do not muddy the measurement
The obvious objection to the table above is that the fund's size moved around a lot over those four years, so surely all that coming and going distorts the per share figure.
It does not, and the reason is worth knowing. Shares in these trusts are created and redeemed in large blocks, in kind, by authorised participants who deliver or receive actual metal. The amount of gold delivered per block is set at the ratio that already applies. If one share is backed by 0.0920 ounces today, a block of 100,000 new shares arrives with 9,200 ounces attached. Gold and shares go up together, in exact proportion, and the gold per share does not move.
Which means the only thing that systematically changes the ratio is the fee. That is why the measurement is so clean, and it is also why this check is one any holder can repeat. Two filings, four numbers, one division.
What the fee does over ten and twenty years
A loss of 0.4 per cent a year is easy to shrug at. The shrug gets harder when you compound it, and harder still when you compare two real funds.
The trust above charges 0.40 per cent. A competing gold trust of similar structure states in its own annual report that its sponsor's fee "is accrued daily at an annualized rate equal to 0.25% of the net asset value", payable monthly, with the trustee selling gold to pay it in exactly the same way. Same metal, same basic structure, a gap of 0.15 percentage points a year.
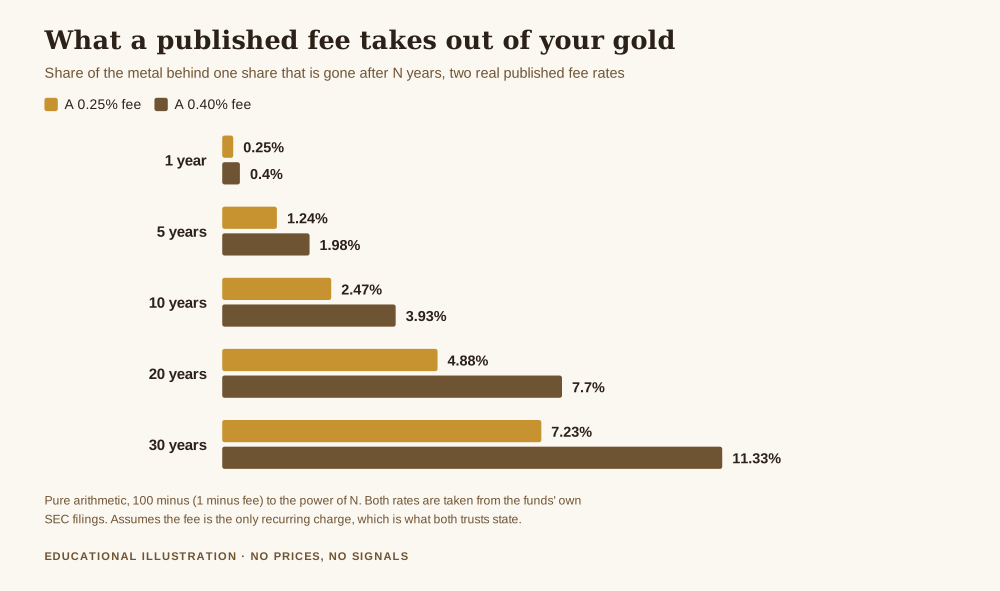
After ten years the cheaper fund has taken 2.47 per cent of your gold and the dearer one 3.93 per cent. After thirty years the figures are 7.23 and 11.33 per cent. That difference, 4.1 percentage points of your metal, is the entire reward for reading one sentence in a filing before you buy.
Notice what this is not. It is not a prediction, and it does not depend on anything gold does. Whether the metal doubles or halves, the fee takes the same fraction of your ounces. It is the most certain number in the whole position, which is a strange thing to say about an investment, and a good reason to treat it as the first thing to check rather than the last.
The part that is genuinely error, not fee
Everything so far has been about the fund's net asset value, meaning the metal it holds. There is a second gap that sits on top, between that value and the price your order actually fills at.
A listed fund trades like a share. During the day its price is set by buyers and sellers, and it can drift slightly above or below the value of the gold inside. The in kind creation and redemption machinery is what normally pulls it back, since a persistent gap is a profit opportunity for the participants who can arbitrage it. In calm conditions the drift is small. In fast conditions, or in the first and last minutes of a session, it is wider.
There is also a timing mismatch worth understanding. The trust values its gold using the LBMA Gold Price, the benchmark administered for the London bullion market, which is struck at set times of day. Your screen, meanwhile, shows a continuously moving spot quote. Comparing a fund's closing price against a spot number from a different moment produces a "gap" that is really just two clocks, and a good deal of the tracking error people report to me turns out to be exactly that.
This second gap is the one that deserves the strict name. It wobbles, it can go either way, and unlike the fee it is not a one way leak. It is also the one you have some control over, through when and how you place an order, which is a different discipline and the same principle as protecting capital when gold gets volatile.
What this does and does not settle
What the measurement settles: for a large physically backed trust, the long run shortfall against the metal is the published fee, to within a rounding error, and you can verify that from public documents in about twenty minutes. Nobody is quietly skimming. The leak is on the label.
What it does not settle is whether a fund is the right way for you to hold gold at all. A fund share is a claim on a pool, not a bar with your name on it, and the difference between those two things matters more to some people than any fee does. I went through that distinction separately in allocated and unallocated gold. Holding metal directly has its own costs, storage and insurance and a wider spread when you sell, and those are not always smaller than 0.25 per cent a year. The honest comparison is cost against cost, not cost against zero.
And none of this says anything about what gold will do, which is the question most people actually want answered and the one no fee table can help with. What moves the metal is a separate subject, and the flows through these very funds are part of it, which I looked at in how gold ETF flows affect the price of gold.
Get the free Black Gold Market blueprint, a short document on protecting capital and on checking a claim against the source before you trade on it. One email, no spam, unsubscribe anytime.
Get the free blueprint →Frequently asked questions
What is gold ETF tracking error in one sentence?
It is the gap between what the fund returns and what the metal returns, and for a large physically backed gold trust almost all of it is the fund's published annual fee, taken in metal rather than cash.
Is the tracking error the same as the expense ratio?
For this kind of fund they are nearly the same thing over long periods, which is the main finding above. Over short periods they can differ, because the market price of the fund can sit a little above or below the value of the gold it holds.
Can a gold fund ever beat the metal?
Not on a sustained basis, because the fee only runs one way. Over a short window a fund can appear to beat gold if the comparison uses a spot quote from a different moment than the benchmark the fund values itself against, but that is a measurement artefact rather than a gain.
How do I check this for a fund I actually own?
Find two of its filings a year or more apart. In each one, note the ounces of metal held and the shares outstanding, and divide. Compare the change against the fee stated in the same document. If the two do not match within a few hundredths of a percentage point, you have found something worth asking about.
Does a bigger fund mean a smaller tracking error?
Size does not reduce the fee, which is the dominant term. Size does tend to tighten the second gap, the one between the fund's price and its value, because larger funds generally trade more and attract more arbitrage activity.
Why does my broker show a different gap than this?
Usually because it is comparing closing prices against a spot quote taken at another time, or over a period too short for the fee to be visible against normal price movement. The fee only emerges clearly over a year or more.
Where Black Gold Market fits
Black Gold Market is a free journal about reading gold and protecting capital, written for people who would rather check a primary source than be told what to think. Nothing here is sold on a promise of returns and there is no signal service. The free blueprint is a short document on protecting capital and on the unglamorous checks that decide whether a claim holds up. The piece underneath all of it is how to protect your capital when gold gets volatile.
About the author. Raphael writes Black Gold Market. He spent a long time assuming fund tracking gaps were some unknowable friction, and then found out the whole thing was written on the second page of a filing anybody can download. What matters to him is the level, the context, and the risk, in that order.
This article is educational and is not financial advice. Trading gold and other leveraged products carries a high risk of losing money rapidly, and no entry, stop or target discussed should be treated as a signal. The sponsor fee rates of 0.40 per cent and 0.25 per cent, the ounces of gold held and the share counts are quoted from the funds' own filings with the United States Securities and Exchange Commission, namely the quarterly report of the larger trust for the period ended 30 June 2026 and the annual reports covering the years ended 30 September 2023 and 30 September 2025, plus the competing trust's annual report for the year ended 31 December 2025. The gold per share figures, the annualised rates of decline and the long run fee tables are my own arithmetic from those published inputs, on the assumptions stated in the text. Decide your own risk, and never trade money you cannot afford to lose.