

There is a number on the screen and there is a number in the dealer's mouth, and the distance between the two is the entire subject of this article. How much does it cost to sell gold is a question that sounds like it wants an answer in percent. It does have one. But the percent is the least useful half of the answer, because a percent tells you what was taken and not what it will take to get it back. The second half, the half almost nobody quotes, is time.
I want to be exact about what this article can and cannot tell you. It cannot tell you what any dealer charges. Nobody can, in general: the gap between the price a dealer sells at and the lower price the same dealer buys back at depends on the product, the dealer, the country and the week. What this article does instead is take that gap as a stated scenario, call it S, and then measure what S costs using the one thing that is published, audited and free to check, which is the London benchmark itself.
The Price You See Is Not a Price You Can Get
Almost every source that quotes "the gold price" is quoting a wholesale benchmark for a good delivery bar, settled between institutions, in quantities no retail seller is holding. That number is real. It is simply not an offer to you. Between it and your bank account sit the dealer's margin, the assay or verification of what you are actually holding, the fabrication premium you paid on the way in and will not get back on the way out, and, depending on where you live, shipping, insurance and tax.
This article excludes all of those except the dealer's margin. That is a deliberate choice and it cuts one way only: every excluded item makes the real answer worse. What follows is a floor on the cost, not an estimate of it.
The Reference Price Is a Timestamp, Not a Fact
Before the spread, there is a smaller problem that is worth thirty seconds of your attention, because it is where a lot of quiet money goes. "What is gold worth today" is a question with a range of answers attached, and the range is not small.
The London benchmark is set twice each business day, once in the morning and once in the afternoon. Across the 2,666 sessions from 4 January 2016 to 19 August 2026 that carried both fixes, the median move between the morning and afternoon settings on the same day was 0.2883%. The upper decile was 0.8701%. The largest was 4.7543%. On 55.48% of days the reference moved at least 0.25% between the two.
So when someone quotes you a buy-back "based on today's price", the honest follow-up is: which one. A dealer working from the morning fix on an afternoon when the market has risen is quoting you a stale reference, and the difference is not a rounding error. This is the cheapest protection in the whole article and it costs one question.
How Much Does It Cost to Sell Gold, Measured in Waiting
Here is the conversion that makes the number mean something. If the round trip costs S percent, then the benchmark has to rise S percent before a seller is merely level again. Not ahead. Level. So I walked forward from every one of the 2,666 sessions in the sample and asked how long that took.
| Assumed round trip | Median wait | Level within 1 year | Never, within sample |
|---|---|---|---|
| 2% | 13 sessions | 92.50% | 1.84% |
| 4% | 36 sessions | 85.18% | 2.81% |
| 6% | 60 sessions | 80.35% | 3.26% |
| 8% | 84 sessions | 73.89% | 4.13% |
| 10% | 110 sessions | 68.30% | 4.84% |
| 15% | 191 sessions | 53.08% | 5.55% |
| 20% | 274 sessions | 45.09% | 5.78% |
A session is a business day, so 252 of them is roughly a calendar year. Read the middle column as the reassuring one and the last column as the honest one. At an assumed 10% round trip, two thirds of starting dates were made whole inside a year, which does not sound bad at all. At 20%, fewer than half were.
And this is the point in most articles where the writer says, reasonably enough, that gold is a long term holding and the spread washes out over time. I believed that too, until I checked which decade I was standing in.
The Part That Makes the Answer Look Kind
The sample above runs from January 2016 to August 2026. Over that stretch the benchmark rose 312.17%, which is 14.33% a year compounded. That is an exceptional decade by any historical standard, and it is doing an enormous amount of the work in every number I just showed you. The market was not washing out the spread. The market was in a strong uptrend that happened to wash out the spread.
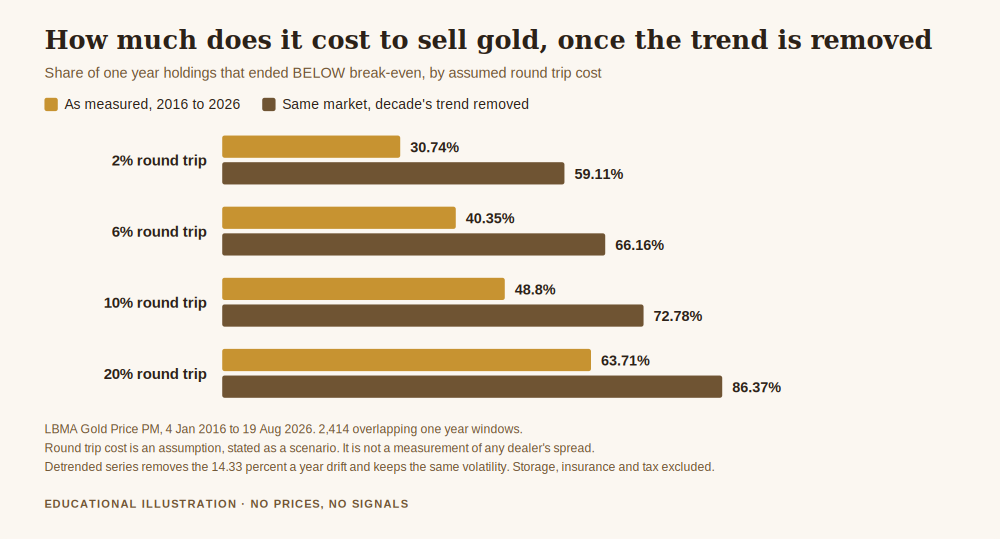
So I ran it again with one change. I removed the drift: the average daily rise, 0.05316% per session, subtracted from every day in the series. Same volatility, same shocks, same crashes, same sequence. Just no long run climb. Then I asked the same question, what share of holdings ended below break-even, of both series.
| Assumed round trip | 1 year, as measured | 1 year, detrended | 5 years, as measured | 5 years, detrended |
|---|---|---|---|---|
| 2% | 30.74% | 59.11% | 0.00% | 83.29% |
| 6% | 40.35% | 66.16% | 0.00% | 84.14% |
| 10% | 48.80% | 72.78% | 0.00% | 85.92% |
| 20% | 63.71% | 86.37% | 90.90% | 90.90% |
Look at the five year columns. As measured, across 1,406 overlapping five year windows, not one ended below break-even at any spread level I tested. Zero. That is the number that gets quoted in every article recommending physical gold as a store of value, and it is true, and it is almost entirely a statement about 2016 to 2026 rather than about gold.
Remove the drift and the same five year hold ends below a 10% break-even 85.92% of the time. The spread did not change. The volatility did not change. Only the tailwind went away, and without it the cost stopped being a delay and became a loss.
I am not forecasting that the tailwind stops. I have no idea. The point is narrower and, I think, more useful: the comfortable answer to this question is borrowed from a specific decade, and if you are relying on it you should at least know that you are.
Get the free Black Gold Market blueprint, a short document on sizing a position so that a cost you cannot avoid stays survivable rather than decisive. One email, no spam, unsubscribe anytime.
Get the free blueprint →What This Does Not Say
It does not say physical gold is a bad idea. People hold it for reasons that have nothing to do with a break-even table, and a cost is not an argument by itself. It says the cost is larger than it looks and is paid at the moment you have least appetite for it, which is when you have already decided to sell.
It does not say a low spread product is automatically better. A traded instrument with a narrow spread carries financing, leverage and counterparty questions that a bar in a safe does not, and my article on trading versus investing is where that comparison belongs.
It does not measure any dealer. Every S in this article is a stated scenario. If you want your own answer, ask for the buy price and the sell price at the same moment, put both against the same published fix, and you will have measured your dealer in about four minutes.
And the detrended series is a thought experiment, not a forecast. It answers one question only: how much of the reassurance came from the trend rather than from the mechanism.
Frequently Asked Questions
How much does it cost to sell gold, in one number?
There isn't one, and anybody who gives you one is quoting their own shop. The structure is what generalises: you buy above a published reference and sell below it, and the round trip is the sum of both gaps. This article prices that sum in waiting time rather than pretending to know its size.
Why measure the cost in time instead of money?
Because money makes it look small and time makes it look accurate. A 10% round trip sounds survivable. A median of 110 sessions before you are merely level again, with roughly a one in three chance of not getting there inside a year, is the same fact with its consequences attached.
Does a bigger bar cost less to sell?
Generally the percentage cost falls as the unit gets larger and more standard, because the dealer's fixed handling and verification costs are spread over more metal. That is a structural expectation, not something measured here, and it is worth confirming with quotes rather than assuming.
Does this apply to trading XAU/USD?
The mechanism does, the size does not. A traded contract has a far narrower spread, but it charges you repeatedly through financing rather than once through the round trip. Commission versus spread covers how that bill is presented, and market order versus limit order covers the part you control.
Where did these figures come from?
All of them are computed from the published LBMA morning and afternoon gold benchmarks, 2,666 sessions from 4 January 2016 to 19 August 2026. The assumptions are listed in the disclaimer below, and the round trip costs are scenarios rather than quotes.
Where Black Gold Market Fits
Black Gold Market is free to follow. Daily XAU/USD analysis with the level, the context and the risk stated before the trade, losing days included, plus an optional Kit for people who want the full method written down. Nothing here promises a profit and nothing here ever will.
Protect comes first, as usual, and the habit this article is really about is checking a price against a published reference before you accept it. How to protect your capital when gold gets volatile is where that habit is written out in full. Commission versus spread is the same question asked of a trading account rather than a dealer's counter. Trading versus investing is the decision this cost feeds into. And what is a margin call covers the cost that arrives when you have no say in the timing at all.
About the author. Raphael writes Black Gold Market. He works on the part of this business that happens before the trade, the level, the context, and the risk, and on the conviction that a method you can follow through a quiet quarter is worth more than a better one you cannot.
Disclaimer: This article is general educational content about transaction costs and how to measure them. It is not financial advice, not a valuation, and not a suggestion to buy or sell any asset. Trading gold, CFDs and leveraged products carries a high risk of losing money rapidly. No entry, stop or target discussed should be treated as a signal. Every figure was computed by me from the published LBMA gold benchmark, morning and afternoon fixes, across 2,666 published sessions from 4 January 2016 to 19 August 2026, using published benchmark values only, with no intraday data. Round trip costs labelled S are stated assumptions and are not quotes from any dealer, refiner or exchange; nothing in this article asserts what any particular seller charges. Storage, insurance, assay, fabrication premium, shipping and any applicable tax are excluded, and each of them makes the real cost higher rather than lower. Break-even walks are censored at the end of the sample, so a start date that never reached its target inside the remaining data is reported as such rather than as an infinite wait. The detrended series removes the sample's geometric daily drift while retaining its volatility and sequence; it is an analytical control, not a forecast of future returns. Overlapping holding windows are not independent observations and the percentages drawn from them should be read as descriptions of this sample rather than as probabilities. No gold price is quoted anywhere in this article and no trading results are represented. Past behaviour of a public benchmark is not a prediction. Further reference data is published by the World Gold Council.