

Ask most people how gold ETF flows affect the price of gold and you will get one of two answers, both of them too confident. The first is that flows are the whole story, that the metal goes wherever the funds push it. The second is that flows are noise, a sideshow next to central banks and jewellery. Neither survives contact with a quarter of actual numbers, and the real answer is more useful than either, because it tells you what to do with the figure when you read it.
I want to do three things here. Show you what one real quarter looked like, explain what actually happens to physical metal when money moves into or out of a fund, and then be honest about the limit of the whole exercise, which is that flow data describes the past more reliably than it predicts the next fortnight.
How Gold ETF Flows Affect the Price of Gold, in One Quarter of Real Numbers
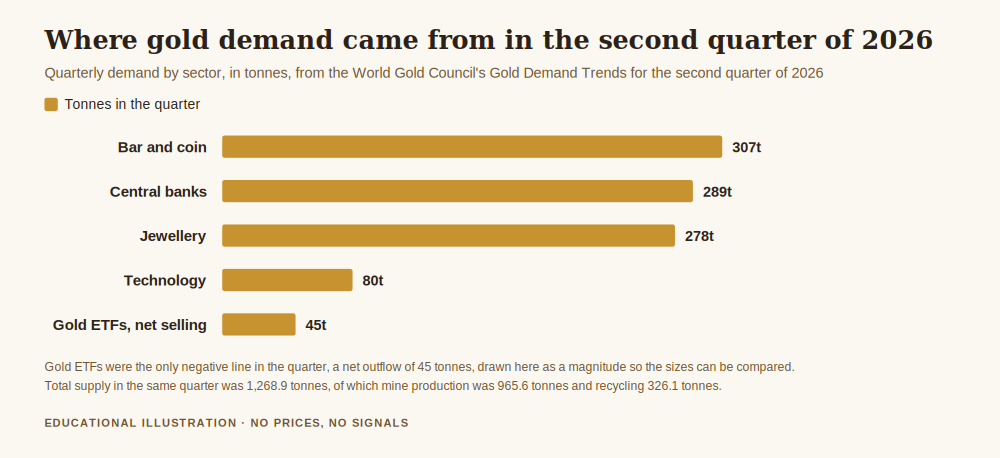
The World Gold Council publishes a quarterly accounting of where gold comes from and where it goes, and the second quarter of 2026 is a useful one to look at because nothing dramatic happened in the headline. In its Gold Demand Trends for the second quarter of 2026, total gold demand including over the counter business was unchanged year on year at 1,269 tonnes. A flat headline, and underneath it, five lines that were not flat at all.
Bar and coin investment held steady at 307 tonnes. Central banks bought 289 tonnes. Jewellery demand fell to 278 tonnes, its lowest quarterly volume since the pandemic. Technology used 80 tonnes. And gold ETFs came under selling pressure, a net outflow of 45 tonnes. On the supply side, mine production was 965.6 tonnes, recycling contributed 326.1 tonnes, and total supply came to 1,268.9 tonnes.
Put the ETF number next to the others and it looks minor. Forty five tonnes is 3.5 per cent of the quarter's total supply, and 4.7 per cent of what came out of the ground. Central bank buying was 289 tonnes, 22.8 per cent of supply, which is to say the official sector absorbed roughly 6.4 times what the funds released. On any reasonable reading of those two numbers, the central banks were the bigger force in the quarter.
So why does anyone watch the small one? Because size is not the only thing that decides whether a line matters. Speed matters, and so does the ability to reverse.
What an ETF Actually Does When Money Moves In or Out
This is the part that gets skipped, and skipping it is why people argue past each other. A physically backed gold ETF is not a bet about gold placed alongside the market. It is a claim on metal sitting in a vault. When money flows into one of these funds and new shares are created, metal has to be bought and delivered into the trust to back them. When investors sell and shares are redeemed, metal comes back out and is released.
That mechanical detail is the reason ETF flows appear in a demand table at all. They are not sentiment. They are purchases and sales of physical gold, denominated in tonnes, the same unit as a wedding necklace or a central bank's reserve addition. The World Gold Council maintains the flow series precisely because it is a real claim on the metal, covering more than 100 physically backed gold ETFs and similar products worldwide.
Contrast that with the positions most of us hold. A leveraged position in gold, whether a CFD or a futures contract, does not move any metal. It is a financial exposure that settles in cash and nets out against somebody else's opposite exposure. It can move price through the order book, but it does not take an ounce off the market or put one back. An ETF creation does. That is a genuine difference, and it is why the fund flow shows up in the physical accounting while your open trade does not.
The Only Line in the Table That Can Change Its Mind
Now look at the other lines again, and ask how quickly each one could move.
Mine production changed by 2 per cent year on year. That is what mine supply does. Opening a mine takes the better part of a decade and closing one is a board decision with consequences, so the number drifts rather than jumps. Recycling fell 6 per cent, and it responds to price and to household need, but slowly, and it is bounded by how much old jewellery exists within reach of a scrap dealer. Jewellery demand fell to its lowest quarterly volume since the pandemic, which sounds dramatic, but it took a sustained move in price to get there, and it will take a sustained move to reverse.
Central bank buying is the largest line after mine supply, and it is the slowest of all in a different sense. It follows reserve management policy set over years, it is largely indifferent to a bad fortnight, and it is reported with a lag. A central bank does not stop buying because the metal had a difficult Tuesday.
Then there is the ETF line. It can be negative one quarter and positive the next, because it is the sum of decisions by investors who can change their minds without asking anyone. Take the quarter above and imagine only that one line reversing: 45 tonnes of selling becomes 45 tonnes of buying, a swing of 90 tonnes, or 7.1 per cent of a quarter's total supply. Nothing else in the table has to move at all. No mine has to be opened, no central bank has to change policy, no household has to sell its jewellery.
That is the honest answer to the question in the title. ETF flows matter not because they are large, but because they are the marginal line: the part of demand that is most willing to change direction at short notice, in a market where almost everything else is slow.
Why 45 Tonnes Can Matter More Than 289
There is an old idea in market structure that price is set at the margin, by whoever is willing to transact right now, rather than by the total stock of an asset held by people who are not selling. Most of the gold ever mined is sitting in vaults, jewellery boxes and reserves, and on any given day almost none of it is for sale. What sets the price is the smaller pool of metal actually changing hands, and the flow that is most willing to switch sides.
That is why a 45 tonne move from a group of price sensitive holders can leave more of a mark than 289 tonnes of buying from institutions that would have bought anyway. The central bank purchase was, in a sense, already in the market's expectations. The ETF flow is the part that surprises.
It also explains why ETF flows tend to move with real yields rather than independently of them. Holding metal earns no income, so the attractiveness of holding it changes as the return available elsewhere changes, and the investors who own gold through a fund are precisely the ones best placed to act on that. If you want the mechanism underneath, it is the same one described in gold vs real yields, and the flow data is largely that relationship expressed in tonnes.
The Part Most Flow Commentary Gets Backwards
Here is the caveat, and it is large enough that I would rather put it in its own section than bury it.
Flows and price move together, but the causation runs in both directions, and quite a lot of it runs the wrong way for anyone hoping to use flows as a signal. Investors buy funds after a rise and sell after a fall. So a quarter of outflows partly reflects what the price already did, and reading it as a forecast of what the price will do next is reading a rear view mirror as a road map.
There is a practical version of this problem too. Flow data is published with a lag, weekly and monthly, and the quarterly picture arrives well after the quarter ends. By the time you read that funds sold 45 tonnes, that selling is finished. It is not a queue of sellers waiting for you.
So the useful way to hold this information is as context rather than as a trigger. Knowing that the marginal buyer has been absent tells you something about why moves have felt heavy. It does not tell you what happens on Thursday, and a position sized as though it does is a position sized on a misunderstanding.
What This Should and Should Not Change
What it should change is your sense of which numbers are load bearing. If your reason for holding a position is that central banks are buying, you are leaning on the slowest, most stable line in the table, and you should expect it to keep being true for a while and to explain very little about this week. If your reason is that funds are accumulating, you are leaning on the fastest and least reliable line, and it can stop being true without any announcement.
What it should not change is how you size. The correct response to any of this is not a bigger position when the flow data agrees with you. Flow data has no bearing on what happens if you are wrong, and the size of a position is a statement about being wrong, not about being right. That is the whole of the Protect pillar in one sentence, and it is worth reading how to protect your capital when gold gets volatile alongside this if the sizing part is what you are working on.
Get the free Black Gold Market blueprint, a short document on protecting capital before you try to grow it, including how to tell a piece of context from a reason to trade. One email, no spam, unsubscribe anytime.
Get the free blueprint →Frequently Asked Questions
So how do gold ETF flows affect the price of gold, in one sentence?
They are the part of physical demand most willing to reverse at short notice, so they tend to set the direction at the margin even when they are small next to central bank buying. In the second quarter of 2026 funds sold 45 tonnes while central banks bought 289 tonnes, and the smaller number was the one doing the changing.
Does buying a gold ETF actually buy gold?
In a physically backed fund, yes. New shares are created against metal delivered into the trust, and redemptions release metal back out. That is why the flow appears in a tonnage table at all, and why it is not comparable to a leveraged position, which moves no metal.
Can I use fund flows to decide when to enter a trade?
Not reliably. Flows partly follow price rather than lead it, and the data arrives with a lag, so by the time you read a figure the transactions behind it are done. Treat it as background on why conditions have felt the way they have, not as a trigger.
Why do central banks buying 289 tonnes matter less than funds selling 45?
They do not matter less in total, they matter less at the margin. Official sector buying follows multi year reserve policy and is largely insensitive to a bad month, so it is mostly already expected. The fund line is the one that can surprise.
Where did the numbers in this article come from?
Every tonnage figure is quoted from the World Gold Council's Gold Demand Trends for the second quarter of 2026, linked above. The percentages are those tonnages divided by the quarter's total supply of 1,268.9 tonnes or by mine production of 965.6 tonnes, arithmetic you can repeat. The 90 tonne swing is simply 45 tonnes of selling turning into 45 tonnes of buying, an illustration of range rather than a forecast that it will happen.
Where Black Gold Market Fits
Black Gold Market is free to follow. Daily XAU/USD analysis with the level, the context and the risk stated before the outcome is known, losing days included. There is a free blueprint for anyone who wants the capital protection material in one place, and an optional Kit for people who want the whole method. Nothing here promises a profit, and nothing here is a signal service. If you are building up the macro picture, read how supply and demand affect the price of gold for the frame this article sits inside, then how central banks affect the price of gold for the slow line that sits next to the fast one.
Read the flow for what it is, a description of who has been willing to change their mind, and size as though they might change it again.
About the author. Raphael writes Black Gold Market. He spends more time on which numbers can reverse than on which numbers are biggest, because the ones that can reverse are the ones that decide how a position feels to hold. Nothing in this article is a recommendation to trade, and no entry, stop or target discussed should be treated as a signal.