

How much gold is recycled is one of those questions that sounds like trivia until you notice what the answer implies. Roughly a quarter of all the gold that reaches the market in a given year was already above ground, sitting in somebody's jewellery box or an old circuit board. It was not mined. It was returned. And the rate at which it comes back is one of the few supply levers that can, in theory, respond to price within weeks rather than decades.
That theory is the interesting part, because in 2025 it did not hold. The price went up a great deal and the scrap barely moved. I want to walk through the actual tonnages, because the gap between what should have happened and what did happen tells you something useful about how this market absorbs pressure.
Everything below is either taken from the World Gold Council's published supply figures or computed by me from those figures, with the arithmetic shown. There are no prices in this article and no forecast.
How much gold is recycled, and how we know
The World Gold Council publishes a supply account every quarter and sums it for the year. For 2025, its full year supply figures give three lines that matter.
Recycled gold came to 1,404.3 tonnes, against 1,365.3 tonnes in 2024. Mine production reached 3,671.6 tonnes, a record, against 3,650.4 tonnes. Total supply was 5,002.3 tonnes, against 4,961.9 tonnes.
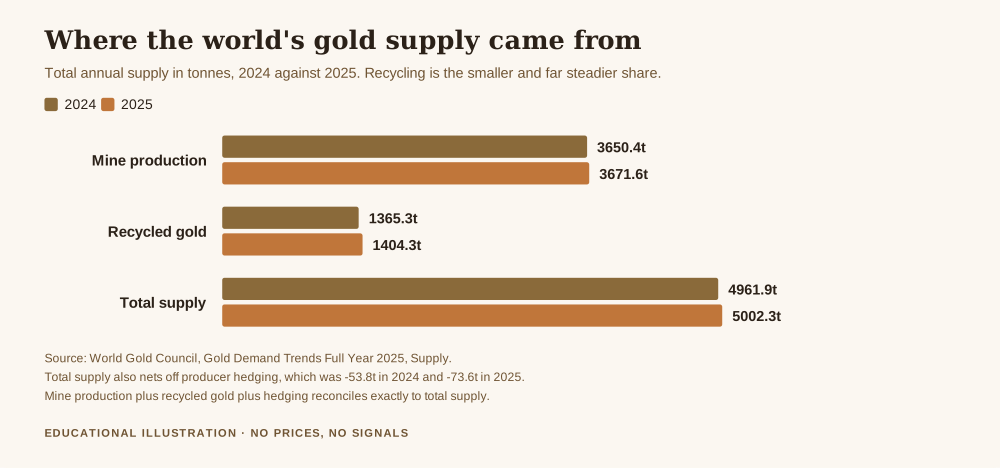
There is a fourth line, net producer hedging, which was -73.6 tonnes in 2025 and -53.8 tonnes in 2024. It is small and it is negative, which means miners were buying back forward sales rather than adding to them.
Worth doing one check before trusting any of this. Add mine production, recycled gold and hedging together: 3,671.6 plus 1,404.3 minus 73.6 gives 5,002.3 tonnes. That reconciles exactly to the published total. The account balances, which is the minimum you should ask of any dataset before you build an argument on it.
So the direct answer to how much gold is recycled: 1,404.3 tonnes in 2025, which is 28.07 per cent of total supply. I get that by dividing 1,404.3 by 5,002.3. For 2024 the same calculation gives 1,365.3 divided by 4,961.9, or 27.52 per cent.
Just over a quarter, then, and remarkably stable from one year to the next. Hold on to that stability, because it is the thing that turns out to be strange.
The part that should surprise you
Recycling is supposed to be the responsive part of gold supply. A mine takes a decade to permit and build, so mine output cannot react to this year's price. But a household deciding whether to sell an old chain can react this afternoon. Economists call this an elastic supply, and the standard expectation is that when the price rises sharply, scrap floods in and caps the move.
In 2025 the annual average gold price rose 44 per cent. That figure is the Council's own.
Recycled supply rose by 1,404.3 minus 1,365.3, which is 39 tonnes, or 2.86 per cent. The Council rounds this to 2 per cent in its text and 3 per cent in its table, which is the kind of discrepancy you get from rounding at different stages; the underlying tonnages are the same and I have used them directly.
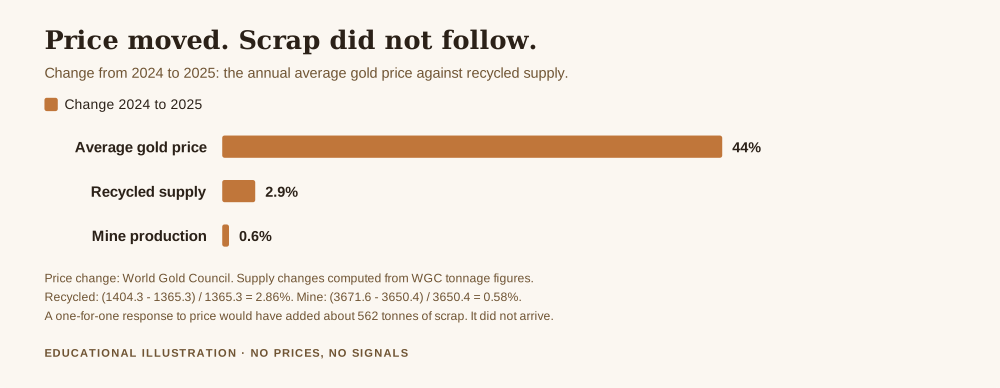
Put those side by side. A 44 per cent move in the average price produced a 2.86 per cent increase in scrap. Divide one by the other and you get roughly 0.065, meaning each 1 per cent rise in the average price brought about 0.065 per cent more recycled metal. That is close to no response at all.
The counterfactual makes it vivid. Suppose scrap had tracked the price one for one, which nobody seriously expects but which marks the far end of the range. Take 2024's 1,365.3 tonnes and grow it by 44 per cent: that is 1,966.0 tonnes. Actual was 1,404.3. The difference is 561.7 tonnes of metal that an elastic supply story says should have shown up and did not. Against 2025's total supply, that absent scrap would have been another 11.2 per cent of the year's entire supply.
The Council does not dress this up. Its own commentary says that given the 44 per cent increase in the annual average gold price, it was a surprise that recycling volume did not increase by more than it did. When the body that compiles the numbers describes its own data as surprising, that is worth reading twice.
Why the scrap does not arrive
The explanation is behavioural rather than mechanical, and it splits by region.
The Council reports that developed markets such as the United States, Europe and Japan saw healthy year on year increases in scrap supply, while emerging markets including India, the Middle East and South East Asia saw declines. Two different populations did two opposite things in response to the same price.
Where gold is mostly an ornament or a forgotten drawer item, a high price is a reason to sell. Where gold is a savings instrument, a rising price is a reason to hold, because the thing that is going up is the thing you were saving in. Selling your savings because they are performing well is not an obvious move. That is the same instinct that keeps a trader from closing a position that is working, except here it is operating across hundreds of millions of households and it is arguably correct.
There are structural brakes too. A lot of gold is not economically recoverable at any plausible price, because it is dispersed in tiny quantities through electronics, and the cost of extraction does not fall when the price rises. A lot more is held in forms with sentimental or social value that no price reaches. And in several large markets the scrap channel runs through informal dealers whose capacity does not expand quickly.
Put together, the pool of gold that will actually respond to price is far smaller than the stock of gold that exists. If you want the wider frame for this, our piece on how supply and demand affect the price of gold sets out the other side of the ledger, and what gold reserves are covers the official holdings that sit outside this account entirely.
What this means for reading the market
I am wary of turning a supply statistic into a trading conclusion, so let me be precise about what this does and does not support.
It does not tell you where the price goes. Supply is one half of a market and the 2025 figures are an annual summary published well after the fact. Nothing in this article is a basis for a position, and no entry, stop or target discussed should be treated as a signal.
What it does do is retire a particular argument. If someone tells you a rally in gold will be capped because high prices bring out the sellers, you now have a year in which exactly that was tested at scale. The average price rose 44 per cent and the supply response was under 3 per cent. The mechanism people invoke is real, but in 2025 it was far too weak to matter.
The second thing it does is calibrate your sense of scale. Total supply moved 0.81 per cent year on year. Mine production moved 0.58 per cent. These are the slow, grinding quantities underneath a market whose price moved 44 per cent. Almost all of that price action came from the demand side and from positioning, not from the physical account. When you read a headline that explains a daily move by referring to mine output or scrap flows, you can now weigh that against how little those lines actually shift.
This is the habit worth building: find out how fast a thing can move before you accept it as the explanation for something that moved fast. Most of the macro stories that circulate fail that test quietly.
What this number does not tell you
A few honest limits, because a figure quoted without its boundaries becomes folklore.
Recycled supply is an estimate, not a count. Nobody files a return when they sell a bracelet. The Council builds the figure from refinery data, trade flows and field research, and it revises it. Treat 1,404.3 tonnes as a careful measurement with a margin around it, not a number read off a meter.
The annual average price rising 44 per cent is not the same as the price being 44 per cent higher at any particular moment, and scrap sellers respond to the price in front of them, not to an annual average. A sharper intra year analysis might find more response than the annual figures show.
And one year is one year. The relationship between price and scrap has been stronger in past cycles, particularly in 2011 and 2012. What 2025 demonstrates is that the relationship is not reliable, which is a weaker and more useful claim than saying it is broken.
Get the free Black Gold Market blueprint, a short document on protecting capital and on checking a claim against the source before you trade on it. One email, no spam, unsubscribe anytime.
Get the free blueprint →Frequently asked questions
How much gold is recycled each year as a share of supply?
In 2025 it was 1,404.3 tonnes out of 5,002.3 tonnes of total supply, which is 28.07 per cent. In 2024 it was 1,365.3 out of 4,961.9, or 27.52 per cent. The share has sat around a quarter to a third for many years, which is why a single year's figure is a reasonable guide to the rough proportion.
Where does recycled gold actually come from?
Overwhelmingly from old jewellery. Industrial scrap, mainly electronics, is a much smaller contributor, because the gold in a circuit board is present in tiny quantities and the cost of recovering it does not fall when the price rises. This is why recycled supply tracks household behaviour in jewellery owning regions far more closely than it tracks technology cycles.
Does recycled gold cap the gold price?
It can in principle and it did not in 2025. A 44 per cent rise in the annual average price produced under 3 per cent more scrap. The capping mechanism exists but it was far too small to restrain the move, which is the main finding of this article.
Is recycled gold worth less than newly mined gold?
No. Once refined to the same fineness it is physically identical and trades at the same price, with no discount for origin. Refining has a cost, which is borne in the spread between what a dealer pays a household and the wholesale price, but the refined metal itself is fungible. The related question of what you own when you hold metal is covered in allocated versus unallocated gold.
Why do the World Gold Council's own numbers say 2 per cent in one place and 3 per cent in another?
Rounding applied at different stages. The table rounds the change between 1,365.3 and 1,404.3 to 3 per cent, the narrative text rounds to 2 per cent, and the exact calculation gives 2.86 per cent. Where a source rounds inconsistently, the right move is to go back to the underlying tonnages and do the division yourself, which is what I have done here.
Where Black Gold Market fits
Black Gold Market is a free journal about reading gold and protecting capital, written for people who would rather check a primary source than be told what to think. Nothing here is sold on a promise of returns, and there is no signal service. The free blueprint is a short document on protecting capital and on the unglamorous checks that decide whether an argument is as solid as it sounds. The piece underneath all of it is how to protect your capital when gold gets volatile, and if you want the market plumbing next to this, read COMEX against the spot price.
About the author. Raphael writes Black Gold Market. He went to check a throwaway line about scrap supply capping rallies, found the Council's own analysts calling their data surprising, and decided the discrepancy was more interesting than the claim he set out to confirm. What matters to him is the level, the context, and the risk, in that order.
This article is educational and is not financial advice. Trading gold and other leveraged products carries a high risk of losing money rapidly, and no entry, stop or target discussed should be treated as a signal. The tonnage figures and the 44 per cent change in the annual average price are quoted from the World Gold Council's published full year 2025 supply account, as linked. The percentages, shares of total supply and the one for one counterfactual are my own arithmetic from those tonnages, with the assumptions stated in the text. Decide your own risk, and never trade money you cannot afford to lose.