

Ask how much gold is mined each year in the world and you will usually get a shrug, a round number, or a figure someone half remembers from a documentary. The actual answer is published every February by a government survey that has been running for decades, it is free, and it is two pages long. For 2025 the estimate is 3,300 metric tons. What follows is where that number comes from, what it looks like broken into days and hours, who produces it, and the one thing it tells you about gold that the price chart never will.
The number, and the document it comes from
The source is the Mineral Commodity Summaries, published by the United States Geological Survey in February 2026. It is the closest thing the industry has to an official annual count, it covers every major commodity, and the gold chapter runs to two pages. I am pointing you at the document rather than paraphrasing it because the whole argument of this journal is that you should be able to check a figure yourself instead of trusting whoever repeated it last.
The headline figures from that chapter are these. World mine production in 2025 was estimated at 3,300 tons of gold content, against 3,280 tons in 2024. World reserves, meaning the gold that is currently economic to extract from known deposits, stand at 66,000 tons. One metric ton is 32,150.7 troy ounces, a conversion the survey prints in its own footnote, and which you need if you want to move between the mining world and the trading world.
Two things are worth noticing before going further. The first is that these are estimates, and the survey says so, marking several country lines as estimated. The second is that the figures are rounded, often to the nearest ten tons. Anyone quoting world gold production to four significant figures is adding a precision the source does not have.
How much gold is mined each year in the world, per day and per hour
Three thousand three hundred tons is not a quantity most people can picture, so it is worth dividing it down. Taking the 2025 estimate and the survey's own ounce conversion, here is the arithmetic, which you can repeat on any calculator.
At 3,300 tons a year, world mine output works out at about 9.04 tons a day. In the unit gold actually trades in, that is roughly 290,700 troy ounces a day, from an annual total of about 106.1 million troy ounces. Run it down to the hour and the whole planet produces around 377 kilograms of gold an hour, every hour, all year.
There is a more useful way to picture the total. Gold has a density of 19,320 kilograms per cubic metre. Three thousand three hundred tons is therefore about 171 cubic metres, which is a cube roughly 5.55 metres on each side. That is the entire world's annual gold production, and it would fit inside a modest bedroom. The scarcity that people talk about loosely is, in the most literal sense, a volume problem.
Who actually digs it up
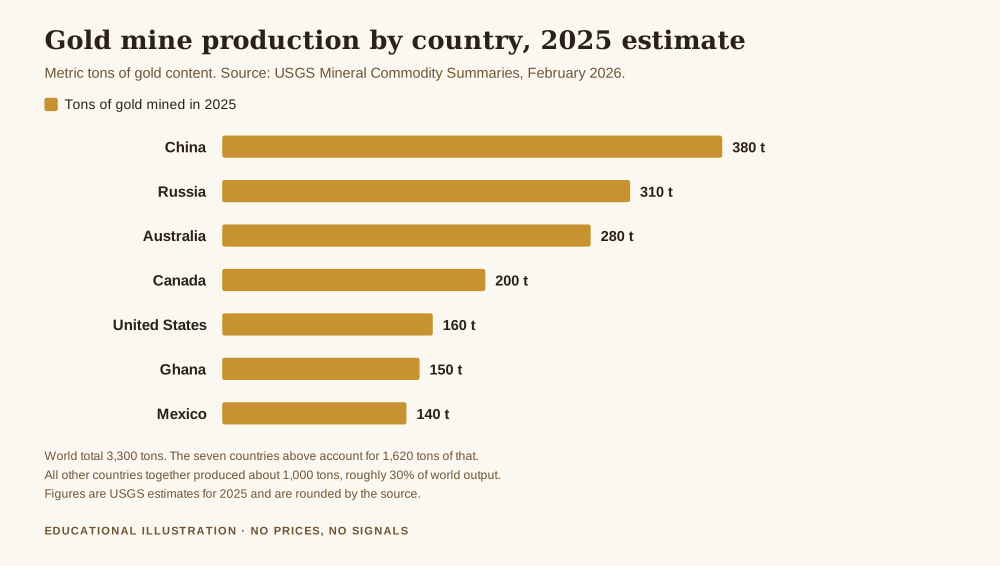
The country table in the survey is where the common assumptions tend to break. South Africa, which most people still name first, produced an estimated 90 tons in 2025 and sits near the bottom of the named list. The order now runs China at 380 tons, Russia at 310, Australia at 280, Canada at 200 and the United States at 160. The survey notes that those five together make up about 41 per cent of global production. Adding the five figures gives 1,330 tons, which against the 3,300 ton total is 40.3 per cent, and the small gap between that and the survey's 41 per cent is simply the rounding working through.
Below the top five come Ghana at 150 tons, Mexico and Kazakhstan and Uzbekistan clustered at 130 to 140, Peru at 110, then Indonesia and South Africa at 90 and Brazil at 80. The thirteen named countries together account for 2,250 tons.
The line that deserves the most attention is the one nobody quotes. Other countries, taken together, produced about 1,000 tons, which is roughly 30 per cent of world output. No single producer comes close to that share. Gold mining is not concentrated in the way oil production is concentrated, and that diffusion is a large part of why the supply side so rarely produces a dramatic headline.
Why the number barely moves
Compare 2025 with 2024 and world production rose from 3,280 tons to 3,300 tons. That is an increase of 0.61 per cent. For a market that moves several per cent in a week, an annual supply change of well under one per cent is close to no change at all.
This is the structural fact that most commentary skips. Gold mine supply is extremely slow to respond. A deposit takes many years to move from discovery through permitting and construction to production, and the decision to build is made against a price nobody can forecast that far out. The result is that mine output in any given year was effectively set by decisions taken long before, and it arrives regardless of what the price is doing this quarter.
So when you see gold move sharply, the explanation is almost never that miners produced more or less of it. Mine supply is the flat line in the picture. The movement comes from the demand side and from the enormous stock of gold that already exists above ground, which is the point this article has been walking towards.
What twenty years of reserves does and does not mean
Set the 66,000 tons of world reserves against annual production of 3,300 tons and you get exactly 20 years. Each year's mining consumes 5 per cent of currently booked reserves. That ratio circulates constantly as evidence that the world is about to run out of gold, and it is worth being careful here, because the claim misreads what the word reserves means.
Reserves are not all the gold in the ground. They are the portion of known deposits that is economic to extract under current conditions, with current technology and current costs. That figure moves as prices move, as methods improve, and as exploration converts resources into reserves. The same survey makes the distinction explicit elsewhere in the chapter, separating identified and undiscovered resources from booked reserves, and it notes that reserves for several countries were revised this year on the back of company and government reports. A reserve life of twenty years has been quoted, in one form or another, for a very long time, and the world has not run out.
Treat it for what it is, an inventory ratio that tells you about the current economics of mining, not a countdown clock.
The number that actually matters if you hold gold
Here is the part that changes how you read everything above. Gold is close to indestructible, so almost every ounce ever mined still exists. The World Gold Council puts the total above ground stock at 222,600 tons as at the end of the second quarter of 2026, and notes that around two thirds of it has been mined since 1950, which is about 148,400 tons.
Now put the two figures side by side. A year of world mining adds 3,300 tons to a stock of 222,600 tons. That is an annual increase of 1.48 per cent. At the current rate it would take about 67 years to double the gold that already exists.
Applying the same density arithmetic to the whole above ground stock gives a cube about 22.6 metres on each side. Every ring, every central bank bar, every coin in every drawer, all of it, inside a cube the height of a seven storey building.
That 1.48 per cent is the single most important number in this article, and it is the reason the supply side rarely drives the price. The gold that could be sold tomorrow is not the 3,300 tons coming out of the ground this year. It is the 222,600 tons already sitting in vaults, jewellery boxes and exchange traded funds, and the Council's own breakdown splits that stock into roughly 99,700 tons of jewellery, 47,800 tons of bars and coins, 39,000 tons held by central banks, about 10,000 tons over the counter and around 4,000 tons in gold backed funds. When any meaningful slice of that existing stock decides to change hands, it dwarfs anything the mines contribute in a year.
This is why I keep returning to the same point in this journal. Supply news is interesting and rarely decisive. If you want to understand why gold moved, look at who already owned it and what changed their mind, not at how much came out of the ground.
Where the 3,300 tons actually goes
The same survey chapter sets out where global gold consumption ends up, excluding exchange traded funds and similar investment vehicles. Jewellery takes the largest share at 40 per cent. Physical bars account for 24 per cent, central banks and other institutions for 21 per cent, official coins and medals for 7 per cent, electrical and electronics for 7 per cent, and everything else for the remaining 1 per cent.
Read that split slowly, because it contradicts a common assumption. Only about 7 per cent of gold consumption is industrial, which means gold is not meaningfully an industrial metal in the way copper is. More than half of it goes into jewellery, bars and coins, which are, in a stressed market, all things people can decide to sell. The share held by central banks is the slowest moving piece of the picture, and it is the piece I have written about separately.
There is also a second source of supply that the production figure leaves out entirely, which is recycling. The survey records an estimated 90 tons of new and old scrap recycled in the United States alone in 2025, equivalent to about 60 per cent of reported American consumption that year. Recycled supply behaves very differently from mine supply. It responds to price quickly, because it comes from people choosing to sell what they already own rather than from a project that took a decade to build. If you are watching for a supply response to a price move, that is where it shows up first, not in mine output.
Get the free Black Gold Market blueprint, the capital protection material in one place, for anyone who would rather understand the market they are trading than react to it. One email, no spam, unsubscribe anytime.
Get the free blueprint →Frequently asked questions
How much gold is mined each year in the world right now?
About 3,300 metric tons, on the United States Geological Survey estimate for 2025, against 3,280 tons in 2024. That is roughly 106.1 million troy ounces a year, or about 9 tons a day. The figure is an estimate and is rounded by the source.
Which country mines the most gold?
China, at an estimated 380 tons in 2025, followed by Russia at 310 tons, Australia at 280, Canada at 200 and the United States at 160. South Africa, long associated with gold, produced about 90 tons. Countries outside the thirteen named in the survey together produced around 1,000 tons.
Will the world run out of gold in twenty years?
That twenty year figure comes from dividing 66,000 tons of reserves by 3,300 tons of annual production, but reserves mean the gold currently economic to extract from known deposits, not all the gold in the ground. The figure moves with prices, costs, technology and exploration, and the survey revised several countries' reserves this year. It is an inventory ratio, not a countdown.
Does more gold being mined push the price down?
Rarely in any direct way. A year of mining adds about 1.48 per cent to the 222,600 tons already above ground, and annual production changed by only 0.61 per cent between 2024 and 2025. The existing stock is so much larger than annual supply that demand for that stock, not mine output, tends to set the direction.
How much gold has been mined in all of history?
Around 222,600 tons as at the end of the second quarter of 2026, according to the World Gold Council, with roughly two thirds of it mined since 1950. Because gold is virtually indestructible, almost all of it still exists in some form. At gold's density that total is a cube about 22.6 metres on each side.
Where Black Gold Market fits
Black Gold Market is free to follow. Daily XAU/USD analysis with the level, the context and the risk stated before the trade, losing days included, on Telegram. There is a free blueprint for anyone who wants the capital protection material in one place, and an optional Kit for people who want the full method. Nothing here promises a profit, and nothing here is a signal service. The groundwork this article rests on is in protecting your capital when gold gets volatile, the country level detail is in how much gold South Africa mines each year, the second supply stream is covered in how much gold is recycled, and the cost side of mining is in what it costs to mine an ounce of gold.
About the author. Raphael writes Black Gold Market. He came to gold through the macro side rather than the chart side, and his standing complaint is that most commentary states a conclusion without ever showing where the number came from. He would rather hand you a smaller claim you can check yourself than a large one you have to trust. Figures here are from the published sources linked above, the calculations state their assumptions so you can repeat them, nothing in this article forecasts the price of gold or is a recommendation to trade or buy any metal, it is not investment advice, and no entry, stop or target discussed should be treated as a signal.