

Ask a room of traders which country mines the most gold and a good number will still say South Africa. It was true once, and it was true for a very long time, which is why the answer survives. So how much gold is mined in South Africa each year now, and what does the honest number tell you about the gold market you are actually trading? The figure is roughly 90 tonnes a year, and the interesting part is not the number itself. It is the gap between that number and what the country still has in the ground.
This one sits under Master. It will not change what you do on a chart this afternoon, and I am not going to pretend it will. What it does is correct a mental model, and wrong mental models are expensive in a slow and quiet way. If you believe one country controls supply, you will read every headline out of that country as a reason for gold to move, and you will be wrong most of the time.
How Much Gold Is Mined in South Africa Each Year, the Short Answer
The US Geological Survey publishes a gold chapter in its Mineral Commodity Summaries every year, and it is the cleanest public source for country level output because it uses the same definitions each time. In the February 2026 edition, South African mine production is given as 90 tonnes for 2024 and an estimated 90 tonnes for 2025.
For scale, the same table puts world mine production at 3,280 tonnes in 2024 and an estimated 3,300 tonnes in 2025. Divide one by the other and South Africa accounts for about 2.73 per cent of the gold mined in the world in 2025. That is the whole of the answer, and it is the part most people get wrong by a factor of five or more.
The same table ranks the producers. China leads at an estimated 380 tonnes, then Russia at 310, Australia at 280, Canada at 200, the United States at 160, Ghana at 150, Mexico at 140, then Kazakhstan and Uzbekistan at 130 each, Peru at 110, and then South Africa at 90, level with Indonesia. Eleventh, give or take a tie. Not first, and not close to first.
Where That Number Comes From, and Why I Trust It
I want to be specific about sourcing here, because country production figures are one of those areas where numbers get repeated for years after they stop being true.
Every figure above comes from one place, the USGS Mineral Commodity Summaries, gold chapter. It is published annually, it is free, and it contains a table called World Mine Production and Reserves with a line for each significant producing country. I pulled three editions rather than one, because a single year tells you nothing about a trend.
It is worth noting what the USGS figures are not. They are estimates for the most recent year, marked as such in the table, and revised in later editions. They measure gold content of mine production, not refined output and not exports. A country can refine far more gold than it mines, which is exactly what happens in Switzerland, and conflating the two is the usual way people end up with a wrong list.
There is a second source worth knowing about, the Minerals Council South Africa, which is the industry body for the country's mining sector. Its gold page is useful for the employment side, where it states that the gold sector employed 93,841 people in 2022, who collectively earned 28.9 billion rand. I am being careful with its production figure, which appears on the page as 84 tonnes without a year attached. An undated number is not a number I will build an argument on, so I have used the USGS series throughout and mention the council's figure only to say that the two sources are in the same neighbourhood.
The Fall, Counted Properly
Here is where it gets genuinely interesting, and where the arithmetic does the work.
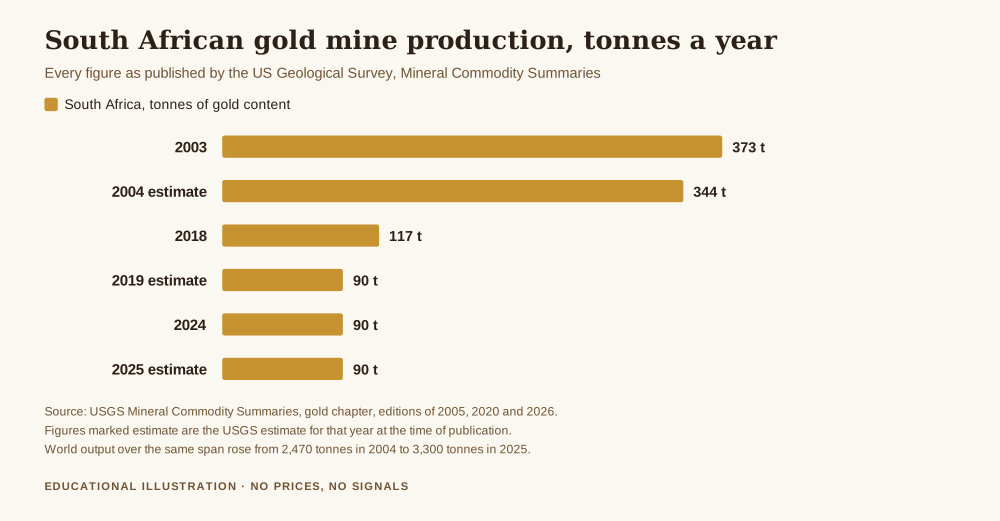
The 2005 edition of the same USGS publication gives South African production as 373 tonnes in 2003 and an estimated 344 tonnes in 2004. The 2020 edition gives 117 tonnes for 2018 and an estimated 90 tonnes for 2019. The 2026 edition gives 90 tonnes for 2024 and an estimated 90 for 2025.
So from 344 tonnes to 90 tonnes over the twenty one years from 2004 to 2025. That is a fall of 254 tonnes, or 73.8 per cent of the starting figure. Compounded, it works out at about 6.19 per cent a year, every year, for two decades. There is no single crisis year in that series. It is a long grind.
Now put it beside the world figure. Over the same span world production went from an estimated 2,470 tonnes to an estimated 3,300 tonnes, a rise of 33.6 per cent. South Africa did not shrink because gold mining shrank. It shrank while gold mining grew by a third.
That is why the share collapses so hard. In 2004 South Africa was about 13.93 per cent of world output. In 2025 it is about 2.73 per cent. The country lost roughly four fifths of its share of the world's gold production inside one working career.
The Part That Does Not Fit, and It Is the Reserves
If the story were simply that South Africa ran out of gold, the reserves line would be near zero. It is not.
The same 2026 USGS table that puts South African production at 90 tonnes puts South African reserves at 5,000 tonnes, against a world total of 66,000 tonnes. So South Africa holds about 7.58 per cent of the world's gold reserves while producing about 2.73 per cent of the world's annual output. Its share of the metal still in the ground is about 2.78 times its share of the metal coming out.
Turn that into years and it is starker. Divide reserves by current annual production and South Africa has about 55.6 years of output in the ground at the present rate. Do the same division for the world and you get about 20 years. South Africa's reserve life is roughly 2.78 times the global average.
Both of those are crude measures and I will say so plainly. Reserves get revised, new deposits get proved up, and a reserve is an economic category rather than a geological one, which means the figure itself moves when costs or prices move. But the direction of the gap is not subtle. This is not a country that has run out of gold. It is a country that is not getting the gold out.
Why the Metal Stays in the Ground
The reason is depth, and depth is a cost problem rather than a geology problem. The Witwatersrand Basin, which the Minerals Council describes as the largest gold resource in the world, has been mined since the 1880s. The shallow, rich, easy material went first, as it always does. What is left sits far deeper, and the deeper you go the more every tonne costs.
You do not need the engineering detail to see the consequence in the numbers. A deposit only counts as a reserve if it can be extracted at a profit under current conditions. South Africa has an unusually large amount of gold sitting right at the boundary of that definition, which is precisely why it can hold 7.58 per cent of world reserves and produce 2.73 per cent of world output at the same time.
It also explains why the decline is a grind rather than a cliff. Mines close one at a time as individual shafts stop paying. That produces the steady 6 per cent a year we counted above, not a crash.
Get the free Black Gold Market blueprint, a short document on protecting capital before you try to grow it, including how to tell which market stories actually move a price and which ones only sound like they should. One email, no spam, unsubscribe anytime.
Get the free blueprint →What This Means for Someone Trading XAU/USD
Mostly it means one specific thing: stop treating South African news as a gold supply event.
At 2.73 per cent of world output, even a severe national disruption is a small number against total supply. Suppose every South African gold mine stopped for a full quarter, which has never happened. That is roughly 22 tonnes of lost output against a world quarter of about 825 tonnes, so under 3 per cent of one quarter's mine supply. Mine supply is also only part of total supply, because recycling adds a large amount on top. So the real share of the total is smaller still.
Compare that with the demand side. The same USGS chapter reports that in the first nine months of 2025, investment in gold backed exchange traded funds and similar products ran to 619 tonnes, which it notes was more than twenty five times the figure for the same period of 2024. One category of investment flow, in nine months, moved a quantity of gold nearly seven times South Africa's entire annual mine output.
That is the useful lesson, and it is a general one. Gold's price is set overwhelmingly by what holders and investors do with the enormous above ground stock, not by the relatively small trickle of new metal. Mine supply changes slowly and is forecast years ahead. Investment demand changes in an afternoon. If you are looking for the thing that moves your chart, you are looking at the wrong half of the market when you look at mine production at all.
None of which makes the production figure worthless. It makes it context rather than a signal, and knowing the difference between those two categories is most of what separates a trader who reads the news from a trader who reacts to it.
What This Article Does Not Say
It does not say South African mining does not matter. It matters enormously to South Africa, where the sector employed 93,841 people in the gold industry alone in 2022. A number can be small as a share of world supply and still be the central fact of a regional economy.
It does not say the decline must continue at 6.19 per cent a year. That figure describes what has already happened between two dated observations. It is not a forecast, and the reserve figure above is a decent reason to think the resource base is not the binding constraint.
It does not say anything about where the gold price is going. Nothing here is a view on direction, and nothing here is a reason to open or close anything today.
Frequently Asked Questions
How much gold is mined in South Africa each year right now?
About 90 tonnes. The USGS Mineral Commodity Summaries of February 2026 gives 90 tonnes for 2024 and an estimated 90 tonnes for 2025, measured as gold content of mine production.
Is South Africa still the world's biggest gold producer?
No, and it has not been for a long time. On the 2025 USGS estimates it sits around eleventh, level with Indonesia at 90 tonnes. China leads at an estimated 380 tonnes, followed by Russia at 310 and Australia at 280.
How much has South African gold production fallen?
From an estimated 344 tonnes in 2004 to an estimated 90 tonnes in 2025, which is a fall of 73.8 per cent, or about 6.19 per cent a year compounded. Over the same period world production rose 33.6 per cent, so South Africa's share of world output fell from about 13.93 per cent to about 2.73 per cent.
Has South Africa run out of gold?
Not by the reserve figures. The 2026 USGS table gives South African reserves of 5,000 tonnes against a world total of 66,000 tonnes, so it holds about 7.58 per cent of world reserves while producing about 2.73 per cent of world output. At the current rate that is about 55.6 years of production still in the ground, against roughly 20 years for the world as a whole. The constraint is the cost of extracting gold at depth, not the absence of gold.
Does South African production move the gold price?
Rarely in any way you could trade. At under 3 per cent of world mine supply, and with mine supply itself only part of total supply, national level disruption there is small against the investment flows that dominate gold. For comparison, the USGS reports 619 tonnes going into gold backed exchange traded funds in the first nine months of 2025 alone.
Where did the numbers in this article come from?
The production and reserve figures are from the USGS Mineral Commodity Summaries, gold chapter, editions of 2005, 2020 and 2026. The employment figure is from the Minerals Council South Africa. The percentages, the share calculations, the compound annual rate and the reserve life figures are not quoted anywhere. They are divisions of those published numbers, with the assumptions written out above so you can repeat them or throw them out.
Where Black Gold Market Fits
Black Gold Market is free to follow. Daily XAU/USD analysis with the level, the context and the risk stated before the trade, losing days included, on Telegram. There is a free blueprint for anyone who wants the capital protection material in one place, and an optional Kit for people who want the full method. Nothing here promises a profit, and nothing here is a signal service.
Reading the supply side properly belongs to Master. How to protect your capital when gold gets volatile is the pillar this article sits under, what is peak gold takes the same production question to the world level, and how much does it cost to mine gold per ounce deals with the cost side that explains why South African metal stays underground. The sources used here are the USGS Mineral Commodity Summaries 2026 gold chapter and its 2020 edition, plus the Minerals Council South Africa gold page and the World Gold Council's production by country data.
About the author. Raphael writes Black Gold Market. He works on the part of this business that happens before the entry, the level, the context, and the risk, and he has a habit of dividing one published number by another to see whether the story holds. Nothing in this article is a recommendation to trade, and no entry, stop or target discussed should be treated as a signal.
Disclaimer: This article is general educational content about gold mine production statistics and the sources that publish them. It is not financial advice, not investment advice and not a recommendation to buy, sell or use any product, venue, dealer or firm. Published statistics are revised over time, and figures quoted here refer to the editions and dates stated. Trading and investing carry risk of loss. Only commit capital you can afford to lose.