

How much does it cost to mine gold per ounce is one of those questions that sounds like it should have a single clean answer, and it very nearly does. The World Gold Council publishes one, it is built from mine level data rather than estimates, and the latest figure on its Goldhub platform is a global average all-in sustaining cost of US$1,785 per ounce for the first quarter of 2026.
That number is worth more than the five seconds it takes to read, because of what it is made of and because of the direction it has been travelling. It has risen in every single year for seven years running, and the reason it keeps rising is not the one most people would guess.
Everything below is either quoted from the World Gold Council's published cost data or computed from those published figures with the assumptions written out. There are no gold prices in this article, and nothing in it is a view on where the price goes next.
How much does it cost to mine gold per ounce, on the published data
The industry measure is all-in sustaining cost, usually shortened to AISC. The World Gold Council's AISC data page publishes it quarterly, drawn from the Metals Focus Gold Mine Cost Service, which collects the numbers mine by mine rather than modelling them from the outside.
For the first quarter of 2026, Goldhub's analysis reports that the global average AISC rose by 5 per cent quarter on quarter and 16 per cent year on year to US$1,785 per ounce. The same piece notes that this was the 28th consecutive year on year increase in AISC, which is seven straight years without a single annual fall.
Before that figure can do any work, it needs unpacking, because "the cost of mining an ounce" is not one cost. It is a stack.
What is actually inside the number
Goldhub splits AISC into two parts, and its quarterly cost analysis sets out both. The first is adjusted operating costs, defined as production costs incurred at the mine site plus royalties and taxes per ounce of gold sold. The second is the gross all-in sustaining cost component, which covers corporate overhead, reclamation and remediation, exploration, and sustaining capital expenditure.
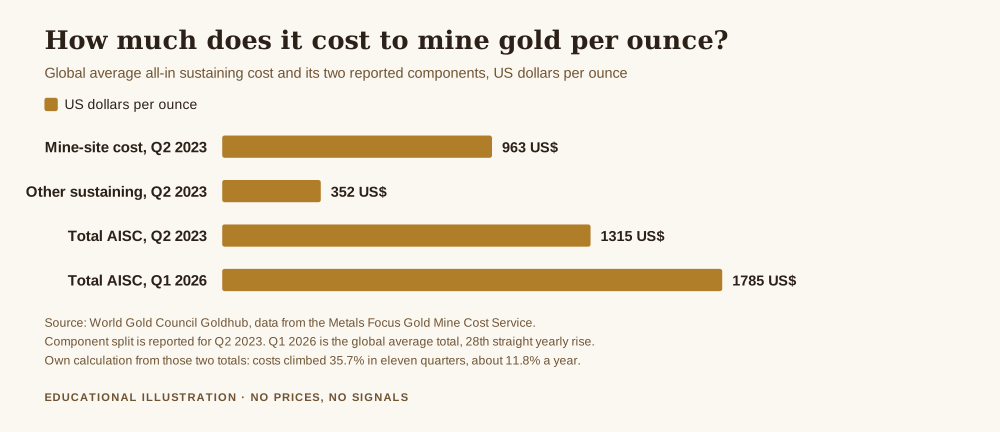
The second quarter of 2023 is the cleanest published split of the two. Global average AISC that quarter was US$1,315 per ounce, of which US$963 was adjusted operating cost and US$352 was the gross component. That is 73.2 per cent and 26.8 per cent respectively, on my own arithmetic from those two figures.
Read the definitions again and notice what is in there. Royalties and taxes are costs. Rehabilitating the site when the mine closes is a cost. Finding the next deposit is a cost. The money spent each year keeping the existing operation running at its current rate is a cost. What AISC tries to capture is not the price of digging up one ounce today, it is the price of being a company that can still dig up an ounce next year.
That is also why AISC is not a GAAP measure and why the figures a single mining company publishes may not line up with the industry average. Each producer defines the edges of it slightly differently, which is a good reason to use an aggregated series from one provider rather than averaging company press releases.
Why the cost keeps climbing
Take those two published totals and compare them. From US$1,315 per ounce in the second quarter of 2023 to US$1,785 in the first quarter of 2026 is a rise of 35.7 per cent across eleven quarters. Compounded, that is 2.82 per cent per quarter, or about 11.8 per cent a year. That is my arithmetic from the two published figures, with no adjustment for inflation and no allowance for changes in the mix of mines in the sample.
The intuitive explanation is diesel, labour and ore grades. Those all matter. But the driver Goldhub names first for the latest quarter is the one almost nobody has on their list: royalties.
Royalty payments rose 24 per cent quarter on quarter and 85 per cent year on year. Royalties were about 6 per cent of the average operation's cost base in the first quarter of 2021, and by the first quarter of 2026 that share had doubled to 12 per cent. On a cost base of US$1,785 per ounce, a 12 per cent royalty share is roughly US$214 per ounce, where a 6 per cent share would be about US$107. That doubling, on my arithmetic, adds something in the order of US$107 to every ounce the average operation produces.
The mechanism is worth understanding, because it is self reinforcing. Several producing countries have moved from flat royalty rates to sliding scales that step up as the gold price rises. Ghana replaced its flat 5 per cent rate with a sliding scale in March, Burkina Faso and Mali operate similar bands, and at IAMGOLD's Essakane mine in Burkina Faso royalty costs surged 220 per cent year on year, reaching 35 per cent of cash costs. Energy has pushed in the same direction, with Goldhub noting that the average US diesel price ended the quarter 54 per cent higher than it began it.
So the cost of production is partly a function of the price of the product. When gold is expensive, the state takes a larger share per ounce, and the measured cost of mining goes up. That relationship is the single most important thing to understand before using this number for anything.
A cost floor is not a price floor
Here is where this number gets misused, and it is worth being blunt about it.
You will see the argument that because it costs roughly US$1,785 to produce an ounce, the price cannot fall below that, or that production cost forms a support level. It is a tidy story. It is also wrong in three separate ways.
The first is distance. Goldhub reports that the average AISC margin, the gap between what producers received and what it cost them, reached a record in the first quarter of 2026, running at roughly 1.72 times the cost of production itself on my calculation from the published cost and margin figures. Work that through and the average producer would need the price to fall by about 63.3 per cent before reaching break-even on an all-in sustaining basis. For the highest cost decile of production, the same arithmetic gives about 48.6 per cent, and their implied AISC is roughly 40 per cent above the industry average. These are not levels anyone is trading against this week.
The second is that mines do not stop when the price touches their cost. A mine is a very large fixed asset with contractual obligations, a workforce, and a closure bill that arrives whether it produces or not. Operations routinely keep running below full cost, trimming sustaining capital and exploration first, which is one reason the gross component is the part that flexes.
The third is that supply from mines is slow in both directions. It takes many years to open a mine and a long time to close one properly, so the production response to any given price move arrives far too late to act as a floor underneath that move. If you want the part of supply that does respond quickly, it is scrap, which I covered in how much gold is recycled, and the wider mechanics are in how supply and demand affect the price of gold.
What the cost number genuinely tells you is something slower and more useful. It tells you how much of the industry is comfortable, how much is marginal, and how much pressure there is on producers to cut the spending that creates future supply. That is structural knowledge, in the same category as knowing what gold reserves are or how gold leasing works. It is not a trade.
What this means for someone trading XAU/USD
Day to day, close to nothing, and I would rather say that plainly than pretend otherwise.
No part of your spread, your swap or your margin is set by mining costs. A retail contract on the gold price never touches a mine, a royalty agreement or a tonne of ore. There is no production cost feed on your platform because there is nothing in it for you to act on in the next hour.
Where it earns its place is in judging the arguments that reach you. When somebody tells you the price cannot go below a number because of what it costs to dig gold up, you now know the three reasons that claim does not hold, and you know where the published figure actually comes from. Protecting capital starts with not acting on arguments that fall apart when you check them, which is the whole point of how to protect your capital when gold gets volatile.
What this article does not say
It does not say US$1,785 is what it costs to mine an ounce at any particular mine. It is a global average of a very wide distribution, and the gap between the cheapest and most expensive operations is far larger than the gap between quarters.
It does not say costs will keep rising. Seven years of annual increases is a trend, not a law, and a large part of the latest rise came from royalty scales that move with the price in both directions.
And it does not quote a current gold price, a production cost support level, or a target. The percentages in the section above are ratios computed from published cost and margin figures, which is a different thing from a price view, and I am not going to blur the two.
Get the free Black Gold Market blueprint, a short document on protecting capital and on checking a claim against the source before you trade on it. One email, no spam, unsubscribe anytime.
Get the free blueprint →Frequently asked questions
How much does it cost to mine gold per ounce right now?
The most recent published global average on the World Gold Council's Goldhub platform is an all-in sustaining cost of US$1,785 per ounce for the first quarter of 2026, up 5 per cent on the previous quarter and 16 per cent on the year.
What does all-in sustaining cost include?
Two parts. Adjusted operating costs, which are production costs at the mine site plus royalties and taxes per ounce sold, and a gross component covering corporate overhead, reclamation and remediation, exploration and sustaining capital expenditure. In the second quarter of 2023, the last clean published split, those were US$963 and US$352 of a US$1,315 total.
Is cash cost the same as all-in sustaining cost?
No, and the difference is usually large. Cash cost covers getting the metal out of the ground. AISC adds the spending required to keep the operation alive, which is why it is the more honest number for asking whether a mine is viable.
Does the price of gold stay above the cost of mining it?
Not by any mechanism. Production cost is not a support level. Mines keep running below full cost because their obligations do not stop, and new supply takes years to arrive, far too slowly to put a floor under a price move.
Why do mining costs rise when the gold price rises?
Partly because several producing countries use sliding scale royalties that take a larger percentage as the price goes up. Royalties went from about 6 per cent of the average operation's cost base in early 2021 to 12 per cent by early 2026, and were the largest single driver of the latest quarterly increase.
Where does this data come from?
The World Gold Council publishes it on Goldhub, using the Metals Focus Gold Mine Cost Service, which builds the series from mine level reporting. It updates quarterly. AISC is not a GAAP measure, so individual company figures may be defined slightly differently.
Where Black Gold Market fits
Black Gold Market is a free journal about reading gold and protecting capital, written for people who would rather check a primary source than be told what to think. Nothing here is sold on a promise of returns and there is no signal service. The free blueprint is a short document on protecting capital and on the unglamorous checks that decide whether an argument holds up. The piece underneath all of it is how to protect your capital when gold gets volatile.
About the author. Raphael writes Black Gold Market. He used to repeat the line about production cost being a floor under the price, until he went looking for the number behind it, found that the number moves with the price itself, and had to retire the argument. What matters to him is the level, the context, and the risk, in that order.
This article is educational and is not financial advice. Trading gold and other leveraged products carries a high risk of losing money rapidly, and no entry, stop or target discussed should be treated as a signal. The all-in sustaining cost figures, the component split, the royalty shares and the quarter on quarter and year on year changes are quoted from the World Gold Council's Goldhub, which publishes them from the Metals Focus Gold Mine Cost Service, all as linked above. The compound rate of cost increase, the component percentages, the royalty per ounce figures and the break-even percentages are my own arithmetic from those published inputs, on the assumptions stated in the text. Decide your own risk, and never trade money you cannot afford to lose.