

The commission vs spread forex question arrives early in most traders' lives and then never quite gets answered. One account type shows a wider spread and charges nothing else. Another shows a tight spread and bills you a commission per lot. Both are presented as the better deal, by people with an interest in the answer, and the arithmetic that would settle it is never shown. So the decision gets made on feel, and feel usually picks the one with no visible fee, because a cost you can see hurts more than a cost baked into a number.
I want to settle it properly, because the answer turned out to be more interesting than I expected. Not because one model wins by a lot, but because when I put real figures against both of them, the gap between the two turned out to be much smaller than the gap between two versions of the same trader on the same account.
What the Two Models Actually Are
Strip the marketing away and there are only two ways a broker can be paid for filling you.
The first is the spread. You are quoted a price to buy that is slightly above the price to sell, and the difference is the broker's revenue. Nothing appears on your statement as a fee. The cost is collected silently, at the moment of entry, in the form of a position that starts underwater.
The second is a raw spread plus a commission. The quoted gap is narrower, closer to what the underlying market is really showing, and the broker charges a stated amount per lot per side instead. Now the cost is visible, itemised, and easy to resent, even when it is smaller.
That is the entire difference. Both are payment for the same service. Neither is inherently honest or dishonest. The only question worth asking is which one takes less from you, and that is arithmetic.
The Commission vs Spread Forex Crossover, in One Line
A standard gold lot is 100 ounces. So a commission of a stated amount per lot per side converts into a per ounce figure by doubling it, for the two sides of the round turn, and dividing by 100.
At a commission of 3.50 per lot per side, that is 7.00 per round turn, which is 0.07 per ounce. Which gives you the whole comparison in one sentence: the commission account is cheaper whenever its raw spread is more than 0.07 per ounce tighter than the all in spread you would otherwise pay.
Change the commission and the threshold moves with it, in a way you can do in your head. At 2.00 per side the threshold is 0.04 per ounce. At 5.00 per side it is 0.10. At 7.00 per side it is 0.14. That is the whole rule, and it is the only part of this debate that has a clean answer.
Everything after this point in the article is my attempt to work out whether the answer matters.
What It Costs on an Actual Gold Trade
To turn the rule into money I have to assume some quotes, and I want to be plain about that: the spread and commission figures below are illustrative assumptions chosen to be plausible, not quotes from any broker, and not an endorsement of any pricing. The market figures are measured and sourced. The pricing figures are stated inputs. Substitute your own and the method still works.
I will use a working denominator of 4,000 per ounce, a round number for the arithmetic rather than any forecast or quoted price, and a lot of 100 ounces.
Four cases, all expressed as a round turn on one lot:
- All in spread of 0.30 per ounce: 30.00 per lot, which is 0.0075% of the notional value.
- All in spread of 0.20 per ounce: 20.00 per lot, 0.0050% of notional.
- Raw spread 0.12 plus 3.50 per side: 19.00 per lot, 0.0047% of notional.
- Raw spread 0.18 plus 3.50 per side: 25.00 per lot, 0.0063% of notional.
Notice what happened there. The tight commission account and the tight spread account came out at 19.00 and 20.00. A one dollar difference on a hundred ounce position. The winner changed depending on the raw spread, not on the model.
Measuring the Cost Against Something Real
Percentages of notional are hard to feel, so let me anchor them to how far gold actually moves.
Across the ten calendar years from 2016 to 2025 the published LBMA gold benchmark produced 2,506 sessions and 2,505 day on day comparisons. The median absolute daily move was 0.4803%. The middle half of sessions ran between 0.2006% and 0.9247%.
Against that median session, the 0.30 spread costs 1.56% of the day's move. The commission account at 19.00 costs 0.99%. Both are small. The difference between them, on one trade, is around half a percent of one ordinary day's range.
The other way to anchor it is in R, the unit of your own risk. If you risk a fixed 1% of the account per trade and your stop sits 1.0% away from entry in price terms, then the round turn cost works out at 0.0075R on the spread account and 0.0047R on the commission account. In plain terms, three quarters of one percent of a single risk unit, against just under half.
If that sounds like nothing, it is because on one trade it very nearly is. Which brings me to the part that actually matters.
The Number That Dwarfs Both of Them
Costs are charged per round turn, so the annual bill is the per trade cost multiplied by how many round turns you do. That multiplication is where the real money is, and it is not close.
Holding the 1.0% stop assumption, and comparing the 0.30 all in spread against the 0.12 plus 3.50 commission account:
- 50 round turns a year: 0.38R on the spread account, 0.24R on the commission account.
- 250 round turns: 1.88R against 1.19R.
- 1,000 round turns: 7.50R against 4.75R.
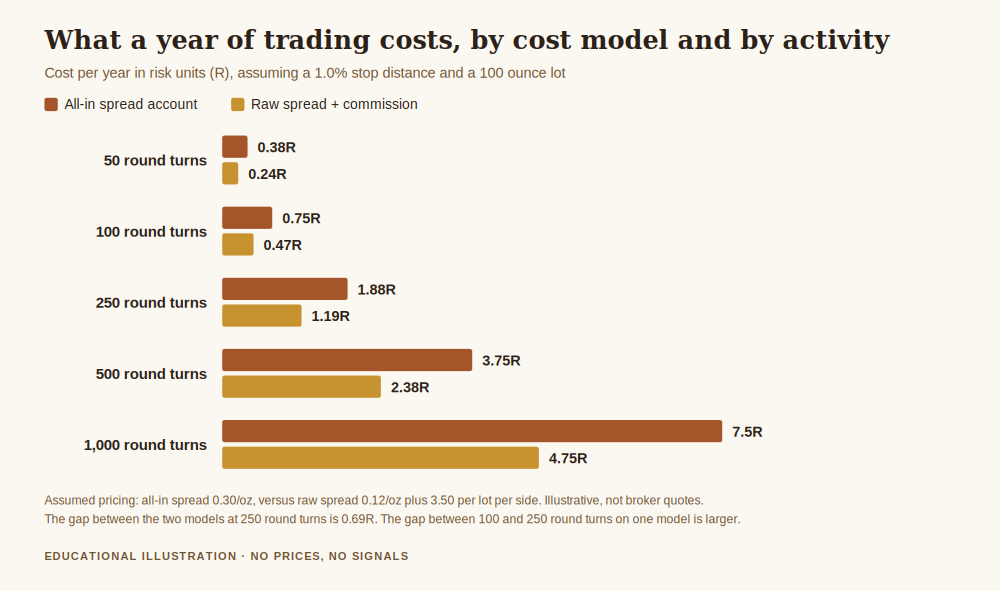
Read those columns down rather than across. Choosing the better cost model at 250 round turns a year saves you 0.69R. Cutting your activity from 250 round turns to 100, while staying on the worse model, saves 1.13R.
The comparison that ends the argument is this one. A trader doing 100 round turns a year on the expensive spread account pays 0.75R. A trader doing 250 round turns a year on the cheap commission account pays 1.19R. The one who chose the worse broker and traded less finished the year with more of their capital intact.
This is why I find the commission vs spread forex debate slightly misdirected. It is a real question with a real answer, and the answer is worth having. It is also worth roughly a quarter of what the frequency question is worth, and it gets perhaps twenty times the attention, because choosing a broker feels like a decision and trading less feels like a loss.
What This Comparison Does Not Include
Three things, and all of them can be larger than the effect measured above.
The first is financing. Holding a position overnight incurs a swap charge that accrues per day and has nothing to do with which cost model you chose. On a trade held for weeks it will dwarf the entry cost entirely.
The second is slippage. The spread you were quoted and the price you were filled at are different things, especially around scheduled news, and a broker with an attractive headline spread that widens sharply under stress can be more expensive in practice than one with a duller quote that holds. No published table will tell you this. Only your own fill records will.
The third is that commission structures often have a minimum charge per ticket. If you trade in small fractions of a lot, that minimum can invert the entire calculation, because the commission stops scaling with your size while the spread cost continues to. Anyone trading micro sizes should redo the arithmetic above with their broker's actual minimum in place before drawing a conclusion.
None of this changes the crossover rule. It just means the rule settles one component of your costs, not all of them.
Why the Visible Fee Feels Worse
There is a behavioural asymmetry here that is worth naming, because it drives more account choices than the arithmetic does.
A commission appears on your statement as a line item with your name next to it. A spread cost appears as a position that opened slightly against you, which most traders read as market noise rather than as a fee. Identical money, two very different feelings, and the invisible one is consistently preferred.
The reason I care is not that people pick the wrong account. Sometimes they pick the right one for the wrong reason and no harm is done. The reason I care is that the same instinct, preferring costs you cannot see, is the one that lets financing charges accumulate unnoticed and lets a widening spread during news pass as bad luck. The cost model question is a small stake. The habit behind it is not.
To be clear about the limits: the frequency figures above assume that a trader doing 1,000 round turns and one doing 100 have the same edge per trade. In practice higher frequency usually means lower quality opportunities as well as higher costs, so if anything I have understated the gap. But that is an argument I have not measured here, and I am not going to present it as though I had. The measured claim is narrow: costs scale linearly with trade count, and that scaling is larger than the model difference.
Get the free Black Gold Market blueprint, a short document for writing down what a year of your own trading actually costs before you go looking for a cheaper broker. One email, no spam, unsubscribe anytime.
Get the free blueprint →Frequently Asked Questions
Commission vs spread forex, which is actually cheaper?
Whichever has the lower total round turn cost, which you can settle with one calculation. Double the commission per side, divide by 100 ounces, and that is the per ounce threshold. At 3.50 per side the threshold is 0.07, so the commission account wins whenever its raw spread is more than 0.07 per ounce tighter than the all in spread. There is no answer that holds across all brokers, only a rule that resolves any specific pair.
How much does the choice actually save me?
On the illustrative figures above, and assuming a 1.0% stop distance, about 0.0028R per round turn, which is 0.69R across 250 round turns in a year. Real but modest. The same arithmetic says reducing from 250 round turns to 100 saves 1.13R on the worse model, which is larger.
Is a zero commission account a marketing trick?
Not necessarily. The broker still has to be paid, so the cost moves into the spread rather than disappearing, and sometimes that arrangement genuinely is cheaper for the client. It becomes a problem only when it stops you from measuring what you paid, because a cost you never total is a cost you never manage.
Does this change for very small position sizes?
Potentially a great deal, because many commission schedules carry a minimum charge per ticket. Below a certain size the commission stops shrinking with your position while the spread cost keeps shrinking, so the crossover moves against the commission account. Check your own broker's minimum before applying the rule.
Where do the market figures come from?
The volatility figures are computed from the published LBMA daily gold benchmark across 2016 to 2025, which is 2,506 sessions and 2,505 day on day comparisons, and the source is linked above so you can rebuild them. The spread and commission levels are stated assumptions used to make the arithmetic concrete, not quotes from any broker.
Should I switch brokers over this?
That is not a decision this article can make, and the figure it produces, well under one R a year for most traders, is smaller than the risks involved in moving to a poorly regulated firm to save it. Regulation, execution quality under stress and whether withdrawals are honoured all matter more than a fraction of a risk unit. The European regulator's own review of retail CFD accounts found between 74% and 89% of them lost money, which puts the size of the cost model question in perspective against everything else that goes wrong.
Where This Leaves You
The commission vs spread forex question deserves about five minutes of your attention, and here is how to spend them. Find your broker's commission per lot per side. Double it, divide by 100, and you have your threshold in dollars per ounce. Compare that against the difference between the two account types' spreads. Pick the cheaper one, write the number down, and stop thinking about it.
Then spend the rest of the afternoon on the question that is worth several times as much. Count your round turns from last year. Multiply by the per trade cost you just calculated. That total, expressed in R, is what your activity level cost you, and unlike the broker's pricing it is entirely within your control.
The framework this sits inside is how to protect your capital when gold gets volatile. The habit that inflates the round turn count faster than anything else is described in overtrading, the habit that drains your account, and the sizing arithmetic that turns these percentages into your own numbers is in position sizing so one trade cannot hurt you.
About the author. Raphael writes Black Gold Market. He works on the part of this business that happens before the trade, the level, the context, and the risk, and on the conviction that a method you can follow through a quiet quarter is worth more than a better one you cannot.
Disclaimer: This article is general educational content about how trading costs are structured and how they accumulate. It is not financial advice, not a recommendation of any broker, account type or pricing model, and not a suggestion to open any particular position. Trading gold, CFDs and leveraged products carries a high risk of losing money rapidly. No entry, stop or target discussed should be treated as a signal. The volatility figures are computed from the published LBMA daily gold benchmark over 2016 to 2025 and describe how a public benchmark moved in the past, not how any account performed. The spread levels, commission levels, the 4,000 per ounce denominator, the 100 ounce lot and the 1.0% stop distance are stated assumptions used to make the arithmetic concrete; they are not quotes from any broker, not prices, not forecasts, and not recommended settings. Substituting your own broker's real figures will change every result. No gold price is quoted anywhere in this article and no real trading results are represented.