

Somebody asked in the group last week how much does gold move in a day, and wanted a single number to plan around. It is a fair question, and it is the one that quietly decides whether a position is sized sensibly or not, because every stop you place is a bet about what a normal day looks like. So I went and measured it properly rather than giving the usual answer, which is that it depends.
The record is the afternoon gold auction published by the London Bullion Market Association, in US dollars, from 2 January 1975 to 25 September 2026. That is 12,981 published fixes and 12,980 day to day changes. I start in 1975 because private gold ownership only became legal again in the United States at the very end of 1974, and the years before that describe a different market with a different mechanism.
There is a number. There is also a complication that matters more than the number, and it has appeared in the last twelve months.
How much does gold move in a day, measured across fifty one years
Taking every one of those 12,980 changes and ignoring direction, so a fall of one per cent counts the same as a rise of one per cent, the middle of the distribution sits at 0.533 per cent. That is the honest headline. Half of all days since 1975 moved less than roughly half of one per cent, and half moved more.
The rest of the shape is where the useful information lives. Three quarters of days came in under 1.040 per cent. Nine days in ten came in under 1.777 per cent. Nineteen in twenty came in under 2.422 per cent. One day in a hundred exceeded 4.288 per cent. The largest single change in the whole record is 13.32 per cent, on 3 January 1980, during the closing weeks of the gold spike that ended that month.
Notice the gap between the middle and the tail. The typical day is 0.533 per cent, and the one in a hundred day is eight times that. This is not a market that varies gently around its average. Most of the time very little happens, and the days that matter are concentrated into a small number of sessions that do not announce themselves in advance.
The number that doubled without an announcement
Here is the part that changed my answer to the original question.
Over the last twelve months, which is 252 trading days to 25 September 2026, the median daily move is 0.999 per cent. Against the 0.533 per cent of the full record, that is 1.87 times as wide. The upper reaches moved with it: three quarters of recent days came in under 1.820 per cent against 1.040 historically, and nine in ten under 2.756 against 1.777.
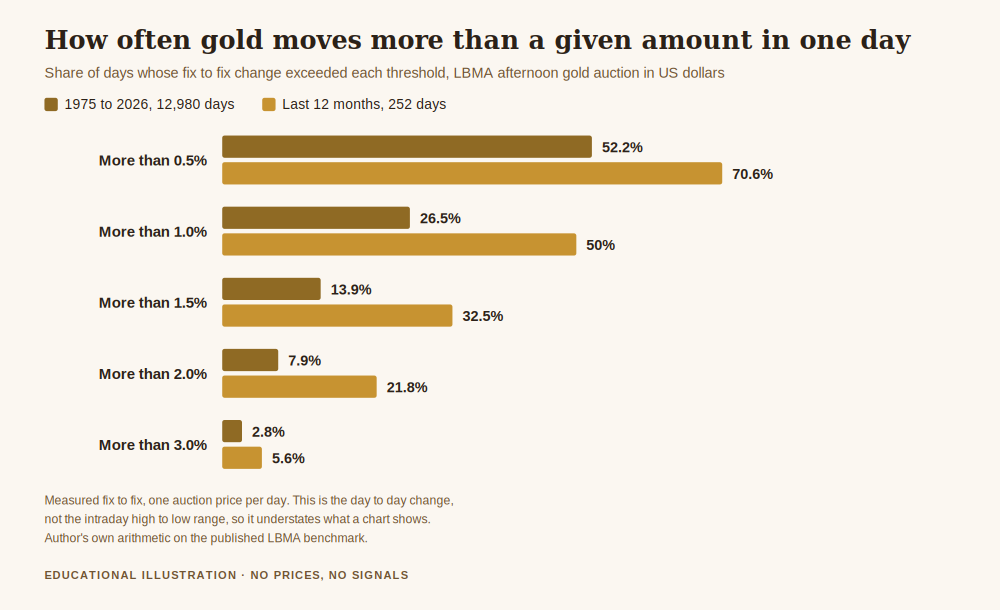
Read across the thresholds and the shift is plain. A move of more than one per cent happened on 26.5 per cent of days across the full record, and on 50.0 per cent of days in the last year. More than 1.5 per cent: 13.9 per cent historically against 32.5 per cent recently. More than two per cent: 7.9 against 21.8. What used to be a notable day is now a coin flip.
The obvious question is whether this is a new permanent level or a passing phase, and the answer from the record is that neither would be unusual. Broken into eras, the median daily move was 0.700 per cent from 1975 to 1989, then 0.338 per cent through the 1990s, 0.568 per cent in the 2000s, 0.506 per cent in the 2010s, and 0.578 per cent from 2020. The quiet decade was less than half as wide as the loud one. So there is no permanent normal to memorise here, which is itself the finding. Anybody who learned their sizing habits in one of those eras and carried them unchanged into another was sized wrongly for years without receiving a single warning.
Why the median is the number to carry, and the record day is not
People reach for the extreme when they discuss volatility, because the extreme makes the better story. The 13.32 per cent day is genuinely interesting and it is almost useless for planning, because it happened once in fifty one years.
The median is the number that describes your Tuesday. It is what you will meet over and over, and it is therefore what your position size has to survive comfortably rather than heroically. A plan that works on a median day and fails on a ninetieth percentile day will fail roughly once every two weeks, and because it survives the other nine days it will feel like bad luck each time rather than a design fault.
That is the connection to everything else. A sensible size is derived from how far the thing actually travels, which is why this measurement sits underneath position sizing so one trade cannot hurt you rather than beside it. If your view of a normal day is 0.5 per cent and the market is currently delivering 1.0, every position you open is carrying twice the risk you think you authorised.
What one ordinary day does to a stop placed inside it
Now the practical arithmetic, and I want to be precise about what it does and does not say.
Take a protective stop placed some distance from your entry, and ask a narrow question: how often would a single day's move, on its own, be larger than that distance. Across the full record, a distance of 0.5 per cent was exceeded by one day's move on 52.2 per cent of days. One per cent: 26.5 per cent of days. Two per cent: 7.9 per cent. Over the last twelve months the same distances were exceeded on 70.6 per cent, 50.0 per cent and 21.8 per cent of days.
This does not say your stop will be hit, and it is not a rule about where to put one. Direction matters, your entry point matters, and a day that moves one per cent away from you is a different event from a day that moves one per cent in your favour. What it says is narrower and harder to argue with: when the distance you have chosen is smaller than what an ordinary day produces, the thing most likely to remove you from the position is not your idea being wrong. It is the market doing its usual daily business. You have not been proven wrong. You have been rounded off.
Which reframes the familiar complaint about being stopped out and then watching price go where you expected. Sometimes that is bad luck. Often it is a stop distance chosen from how much the trader was willing to lose rather than from how far the instrument actually travels, and those are two different questions that only accidentally give the same answer. The first sets your position size. The second sets your stop distance. Working out how much capital that combination genuinely needs is the subject of how much do you need to trade gold.
What this measurement genuinely cannot see
I would rather state the limitation than have somebody find it, because it is a real one and it cuts in a specific direction.
The LBMA publishes one auction price per day. Every figure above is therefore a fix to fix change: yesterday's auction against today's. It measures how far the market travelled between two fixed points in time, and it is completely blind to the path in between. A day that rose two per cent, fell three, and closed exactly where it started registers here as a move of zero. On a chart it was a wide and difficult day.
So every number in this article is a floor, not a ceiling. The true intraday range, the distance from high to low that you actually trade inside, is reliably larger than these figures, and often considerably so. When I say the median day moves 0.533 per cent, the honest reading is that the median day ends up 0.533 per cent from where it began, and that the journey was wider. That makes the practical conclusion stronger rather than weaker: if a stop is already inside the fix to fix move, it is even further inside the real range.
Two smaller caveats. Auction days are not calendar days, so weekends and holidays are absent and a Monday change contains a weekend. And the per cent changes are not adjusted for inflation, which matters for comparing the 1980 figures with today's in real terms but not for the question asked here, which is about proportional movement.
What this does and does not change
It does not forecast tomorrow. A distribution describes what has happened, and the next day is drawn from a distribution nobody can see. The last twelve months being twice as wide as the long record does not mean the next twelve will be, and I would be doing exactly the thing I criticise if I claimed otherwise.
It does not tell you where to place anything. There is no stop distance in this article and there will not be one, because that depends on your method, your account and your reason for being in the trade, none of which I know.
What it does change is the size of the thing you are planning around, and that you can act on. Measure the current width rather than the remembered one. Re-measure it when the market feels different, because the record says these regimes last for years and shift without ceremony. And hold the ordinary day in mind, not the dramatic one, because the ordinary day is what you will meet several hundred times a year. This is the same discipline as measuring gold price seasonality before believing it, applied to a number that changes far more often than the calendar does.
The full job this belongs to is protecting your capital when gold gets volatile. Most of that work is not done while the market is moving. It is done beforehand, in the unexciting business of knowing how far this thing usually travels before you decide how much of it to carry.
Get the free Black Gold Market blueprint, a short document on protecting capital before you try to grow it, including how to size a position from how far the market actually travels. One email, no spam, unsubscribe anytime.
Get the free blueprint →Frequently asked questions
So how much does gold move in a day, in one number?
Across 1975 to 2026 the median day moved 0.533 per cent, ignoring direction. If you want a number for the market as it is now rather than on average, the median over the last twelve months is 0.999 per cent. I would carry both, because the gap between them is the actual lesson.
Why measure the median instead of the average?
Because a handful of enormous days pull an average upward and leave you with a figure that describes almost no real day. The mean daily move on this record is 0.794 per cent, half again as large as the median, and that difference is entirely the tail. The median answers the question people are actually asking, which is what a typical day looks like.
Is gold more volatile now than it used to be?
Over the last twelve months, measurably yes, at 1.87 times the long run median. Whether that persists is unknown. What the record does show is that these phases are real and long: the 1990s ran at a median of 0.338 per cent and the 1975 to 1989 stretch at 0.700 per cent, so a trader could spend a decade inside one regime and mistake it for the permanent state of things.
Does this tell me where to put my stop?
No, and it is not meant to. It tells you how large an ordinary day is, so you can tell whether a distance you were already considering sits inside or outside that. Where a stop belongs depends on your method and your reason for the position, and no figure in this article is a recommendation about either.
Does the daily range not matter more than the daily change?
It does, and that is the honest weakness here. One auction price per day cannot see the high or the low, so these figures measure where the market ended up rather than how far it went. The real range is larger. Every conclusion drawn above therefore understates the case rather than overstating it.
Where did these numbers come from?
All of them are my own arithmetic on the LBMA afternoon gold auction in US dollars, linked above, covering 2 January 1975 to 25 September 2026, which is 12,980 consecutive fix to fix changes. Moves are simple percentage changes between consecutive auctions, taken as absolute values so direction is ignored, and percentiles are taken by linear interpolation. The last twelve months means the 252 changes from 25 September 2025 onward. The stated limitation is that one auction price per day cannot observe the intraday path. No gold price level appears anywhere in this article.
About the author. Raphael writes Black Gold Market. He would rather publish the boring middle of a distribution than the dramatic edge of one, because the middle is what a trader actually meets and the edge is what they tell stories about. Nothing in this article is a recommendation to trade, and no entry, stop or target discussed should be treated as a signal.