

Almost everyone asking how to have an edge in trading is asking how to find one. That is the second question. The first question, and the one nobody asks, is how you would ever know that you had. Because the uncomfortable fact underneath this whole business is that a run of results and a real advantage look identical for a very long time, and most traders make their biggest decisions inside the window where the two are still indistinguishable.
I want to put numbers on that window. Not to discourage anyone, but because a trader who knows how long the evidence takes to arrive behaves completely differently from one who does not, and the difference shows up in the account.
What an Edge Actually Is, in One Sentence
An edge is a positive expected result per trade, after costs, that persists on data your method has never seen.
Every clause in that sentence is doing work. Positive expected result, so not a good week. Per trade, so it survives being divided by how often you act. After costs, because a method that is profitable gross and unprofitable net is not an edge, it is a hobby with paperwork. And persisting on unseen data, because anything can be made to look profitable on the history you used to design it.
Notice what the definition does not mention. It says nothing about being right often, nothing about how the chart looks, and nothing about confidence. Those are the things people usually mean by edge, and they are the reasons the word has become almost useless in conversation.
The Baseline Your Edge Has to Beat
Before measuring anything, you need to know what no skill at all produces, because a number without a baseline means nothing.
Using the published LBMA gold benchmark, I took the ten years from 2016 to 2025, which is 2,506 fixings, and simulated 100,000 completely random long entries. No signal, no analysis, no timing. Buy on a randomly chosen day, hold for ten fixings, record the result.
That random, skill-free approach won 57.26% of the time, with an average result of plus 0.609% per holding period.
Read that again if you keep a journal showing a win rate somewhere in the fifties. On this instrument over this decade, a coin toss with a long bias produced a win rate in the fifties, because gold rose 303.6% across the window and any long-biased approach inherited that drift. A win rate above half is not evidence of an edge on a rising instrument. It is the starting line, not a result.
This is the single most common measurement error I see. People compare their record against zero, when the honest comparison is against what randomness would have produced in the same market over the same period. The gap between those two is the only part that belongs to you. That is also why the win rate on its own tells you so little, a point I have made from the other direction in how to increase win rate in trading.
How to Have an Edge in Trading Means Proving It, Not Feeling It
Now the harder part. Suppose you have a method and you want to know whether it works. You run it, you record the results, and after some number of trades you look at the total. How much does that total actually tell you?
I simulated the two ways it can lie.
The first liar is a trader with no edge whatsoever. Wins half the time, wins one R, loses one R, expectancy exactly zero by construction. Across 200,000 simulated careers, this trader is still showing a profit 41.0% of the time after 20 trades, 46.0% of the time after 100 trades, and 48.3% of the time after 500 trades.
The second liar is a trader who genuinely does have an edge. Wins 36.67% of the time, wins two R, loses one R, which works out to plus 0.10R per trade. A real, positive, durable advantage. Across 100,000 simulated careers, this trader is still showing a loss 35.64% of the time after 20 trades, 25.82% after 100 trades, and 5.86% after 500.
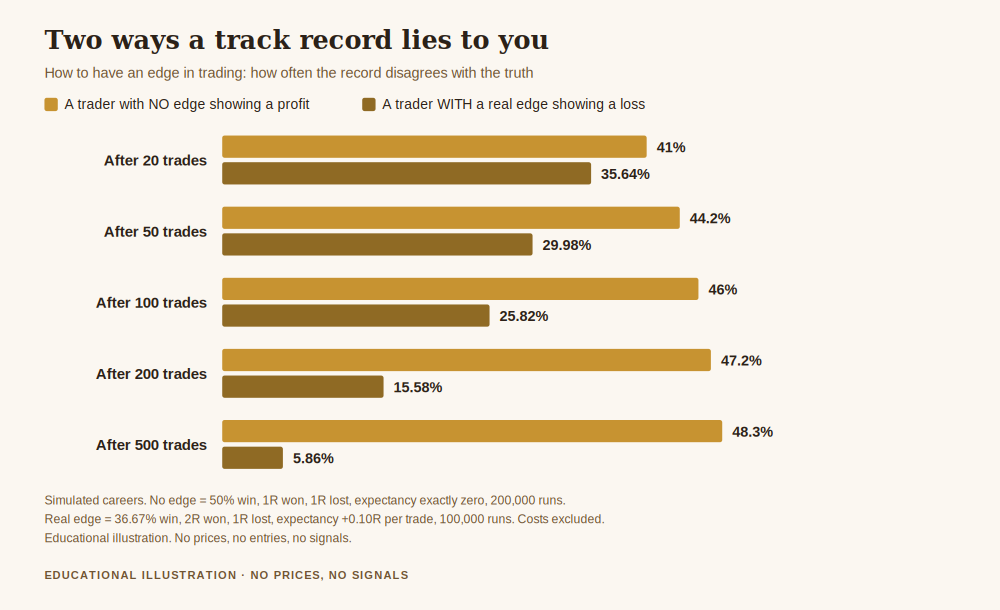
Put the two together and look at the hundred trade line, because that is where most people are making decisions. At one hundred trades, a trader with nothing is in profit almost half the time, and a trader with something real is in the red a quarter of the time. Both errors are live at once. A hundred trades is not a small sample by the standards of how people actually behave, and it settles nothing.
How Long Before the Record Can Tell
There is a cleaner way to see the same thing, and it does not require simulation, only division.
The edge in the example above is 0.10R per trade. The variation around it, the standard deviation of a single trade, is 1.446R, which follows arithmetically from winning 2R at a 36.67% rate. The noise around your running average shrinks with the square root of the number of trades, and never faster.
Working that through: after 20 trades the ordinary range of your average result is roughly plus or minus 0.634R, which is more than six times the edge you are hunting for. After 100 trades it is plus or minus 0.283R, still nearly three times the edge. After 500 trades it is plus or minus 0.127R, and only somewhere past a thousand trades does the noise finally shrink below the signal, to about plus or minus 0.090R.
That is the whole problem in one line. For a normal edge on a normal instrument, the number of trades required before your own results can distinguish skill from luck is in the hundreds at minimum, and comfortably over a thousand before it is settled.
Most traders change their method well before then. They change it after a bad fortnight, which is fully consistent with having an edge, or they scale it up after a good month, which is fully consistent with having none. Both decisions are made with evidence that cannot support them, which is why the same trader can spend years switching between methods that might all have been fine.
What This Does Not Mean
Two misreadings to close off, because this argument gets stretched in both directions.
It does not mean you should trade a losing method for a thousand trades to be sure. Sample size is not the only source of evidence. If your method has no logical reason to work, or if your costs plainly exceed any plausible gross result, you can rule it out on arithmetic long before the record does. The noise argument applies to methods that are plausible and whose results are ambiguous, which is most of them.
It also does not mean edges are unknowable or that measurement is pointless. It means the opposite. Because the record takes so long to speak, everything else you can measure matters more: whether you followed the rules, whether your costs are what you assumed, whether your risk per trade stayed constant. Those are observable after ten trades, not a thousand, and they are the reason regulators publish figures like ESMA's finding that between 74% and 89% of retail CFD accounts lose money. That range is not made of people whose edges were too subtle to detect.
Four Things That Make an Edge Testable
None of this requires new software. It requires that your record be capable of answering the question, which most records are not.
Write the rule before the trade, in a form someone else could follow. If the entry condition lives in your head, every result is unattributable, because you cannot tell afterwards whether a loss came from the method or from a version of the method you improvised.
Hold risk per trade constant. If size varies with confidence, your results measure your confidence, not your method, and the two cannot be separated afterwards at any sample size.
Record costs on every trade, including the flat ones. An edge is defined after costs. A gross figure answers a question nobody asked.
Keep the change log. Every time you alter the rule, the count restarts, and this is the step everyone skips. A trader who has taken 800 trades across eleven versions of a method has not tested anything 800 times. They have eleven small samples and one long story.
Protect, Master, Grow
Protect comes first, and here it has a precise meaning. If it takes hundreds of trades to learn whether your method works, then the only unforgivable error is one that ends the sample early. Position size is not a growth decision, it is what buys you enough trades to find out anything at all.
Mastery is accepting the timescale rather than fighting it. The trader who understands that a hundred trades settles nothing stops reading each fortnight as a verdict, and that alone removes most of the reasons people abandon methods that were working.
Growth follows from the first two. An edge of 0.10R per trade is worth having and worth nothing if you cannot survive long enough to collect it. The advantage compounds slowly and the mistakes compound quickly, which is the whole reason the order of these three words is not decorative.
Get the free Black Gold Market blueprint, a short document for writing your rule down before the trade so your record can actually answer whether the rule works. One email, no spam, unsubscribe anytime.
Get the free blueprint →Frequently Asked Questions
How many trades do I need before I know if I have an edge?
For an edge of about 0.10R per trade with the variation described here, the noise around your average only falls below the edge itself somewhere past a thousand trades. At a hundred trades the noise is roughly three times the edge. A larger edge is detectable sooner and a smaller one takes longer, so the honest answer is that it depends on the size of the edge, and that almost nobody has as many trades as they think they need.
My win rate is above 50%. Is that an edge?
Not on its own, and on gold specifically it is a weak signal. Random long entries on the LBMA benchmark over 2016 to 2025 won 57.26% of the time with no method at all, because the instrument rose across the period. Win rate has to be read alongside what you win versus what you lose, and against what randomness produced in the same market.
Where do the simulation figures come from?
They are simulated, not observed, and the assumptions are stated so you can rebuild them. The no edge case is 50% wins, 1R won, 1R lost, 200,000 careers. The real edge case is 36.67% wins, 2R won, 1R lost, giving an expectancy of plus 0.10R and a per trade standard deviation of 1.446R, 100,000 careers. Costs are excluded from both, which flatters the no edge trader.
Does a backtest count towards the sample?
Only if the method was fixed before you saw that data. A backtest you adjusted while looking at the results is a description of the past, not a test, and the number of trades in it does not reduce your uncertainty about the future. This is the most expensive misunderstanding in the whole subject.
Should I stop trading until I have a thousand trades of proof?
No, and that would be an impossible standard, since the only way to accumulate the sample is to trade. The instruction is about how you interpret the record along the way. Trade the method, keep risk small enough that the sample survives, and stop reading short runs as evidence in either direction.
What if my results are much better than the example?
Then either your edge is genuinely larger, in which case it becomes detectable sooner, or your sample is small and you are looking at the top of the range that luck produces. Both are consistent with what you are seeing, and the way to separate them is to keep the rule fixed and keep counting rather than to scale up.
Do these figures apply outside gold?
The random entry baseline is specific to gold over this decade and other instruments will differ, particularly ones that did not trend. The sample size arithmetic is not specific to anything, since it follows from the size of the edge and the variation around it, and applies to any market you can measure.
Where This Leaves You
The question of how to have an edge in trading turns out to have two halves, and the second one gets almost no attention. Finding a candidate is the easy half. Building a record capable of telling you whether the candidate is real is the half that takes years, and the reason it takes years is arithmetic rather than character.
What you can do this month is make your record able to answer the question at all. Write the rule down. Hold risk constant. Count costs. Log every change and restart the count when you change something. None of that requires knowing whether you have an edge, and without it you will never find out.
If you want the wider framework this sits inside, that is how to protect your capital when gold gets volatile. The companion argument about reading probability rather than outcomes is trading is a game of probability, and the measurement discipline behind both is in how to increase win rate in trading.
About the author. Raphael writes Black Gold Market. He works on the part of this business that happens before the trade, the level, the context, and the risk, and on the conviction that a method you can follow through a quiet quarter is worth more than a better one you cannot.
Disclaimer: This article is general educational content about measuring trading results. It is not financial advice and it is not a recommendation of any strategy, instrument or holding period. Trading gold, CFDs and leveraged products carries a high risk of losing money rapidly. No entry, stop or target discussed should be treated as a signal. The win rate, expectancy and standard deviation figures describe simulated models under the assumptions stated in the article, not any real account, and no real trading results are represented anywhere. The random entry baseline is computed from the published LBMA daily gold benchmark over 2016 to 2025 with costs excluded, describes how that benchmark moved in the past only, and the source is linked so you can check it. A historical result on one instrument over one decade is not a forecast. No price levels are quoted anywhere in this article.