

The question arrives every autumn, phrased a dozen different ways. Is this a good month for gold. Does gold always rally into the new year. Somebody in the group has seen a chart with twelve bars on it and wants to know whether gold price seasonality is a real thing you can lean on, or one of those ideas that survives because nobody checks it.
It deserves a proper answer rather than a shrug, so I went and measured it. The record I used is the afternoon gold auction published by the London Bullion Market Association, in US dollars, from the start of 1975 through to 24 September 2026. That gives 620 month end to month end moves across fifty one and a half years. I start at 1975 because private gold ownership was only made legal again in the United States at the very end of 1974, and prices before that are not describing the same market.
What follows is what the numbers say. It is not the answer most seasonality charts imply.
What gold price seasonality looks like when you actually measure it
Average all 620 months together and gold moved 0.514 per cent a month. The standard deviation around that average is 5.319 per cent, which is the first number worth sitting with. The typical month is roughly ten times noisier than the typical month's drift.
Now split those months by the calendar. The strongest month in the full record is January, averaging 1.781 per cent. The weakest is March, averaging minus 0.648 per cent. So the entire spread between the best calendar month and the worst is 2.429 percentage points.
Put that spread next to the 5.319 per cent standard deviation of a single month and you have the whole problem in one ratio. The full seasonal effect, best to worst, across the entire calendar, is 0.46 of one month's ordinary variation. The pattern is smaller than the noise it is sitting inside. You are being asked to read a signal that is less than half the height of the interference.
There is one more way to see it before we get to the interesting part. Of the twelve months, eleven have a 95 per cent confidence interval that comfortably contains zero. In plain language, for eleven months out of twelve, fifty one years of data cannot rule out the possibility that the month has no effect at all.
The month that passed the test, and the test it then failed
January is the exception, and only just. Its 95 per cent interval runs from plus 0.01 to plus 3.56 per cent. The lower edge sits one hundredth of a percentage point above zero. It clears the bar by the width of the bar.
It is worth asking how much evidence that took. Working backwards from January's own average and its own variability, you would need 51 years of Januaries for the interval to just exclude zero. We have 51 years of Januaries. The effect became marginally detectable at the exact moment the data ran out, which is not the signature of something sturdy.
And in those 51 Januaries, gold finished higher 28 times. That is 55 per cent. If someone offered you a coin that came up heads 28 times in 51 throws, you would not describe it as a loaded coin. You would describe it as a coin.
Then comes the test that settles it. Cut the record in half and ask whether January behaves the same way in both halves. From 1975 to 2000, January averaged plus 0.161 per cent and finished higher in 10 of 25 years, which is 40 per cent, worse than a coin flip. From 2001 to 2026, January averaged plus 3.339 per cent and finished higher in 18 of 26 years.
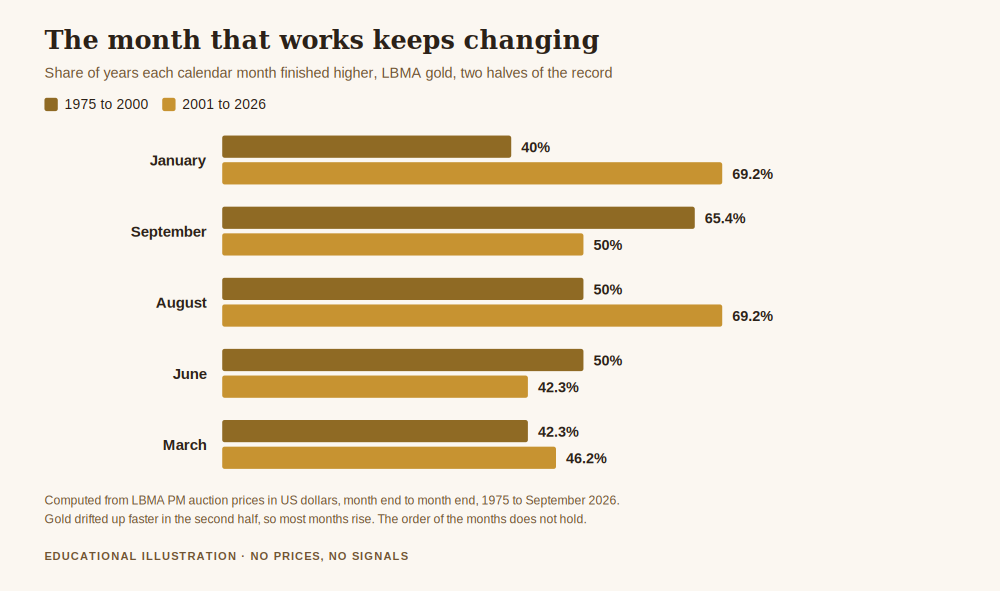
The entire January effect lives in one half of the record. In the other half it is absent, and slightly negative on the hit rate. A real seasonal force, something structural about demand or the calendar, would not switch on in 2001. A run of luck would look exactly like this.
September makes the same point from the other direction. In the first half it was the best month of the year, averaging plus 2.44 per cent and finishing higher in 65.4 per cent of years. In the second half it is mid-pack, averaging plus 0.72 per cent, finishing higher exactly half the time. Anyone who built a September rule from the first twenty five years of data spent the next twenty five years being ordinary.
Across all twelve months, only 8 stay in the same half of the ranking when you move from one era to the other. A third of the calendar swaps sides.
Why testing twelve months guarantees you a winner
This is the part that seasonality charts never print underneath themselves, and it is the part that matters most.
When you test something at 95 per cent confidence, you are accepting a one in twenty chance of calling a result real when it is not. Test one thing, and that risk is small. Test twelve things, which is exactly what a calendar does, and the expected number of false positives is twelve times one in twenty, which is 0.6.
So before looking at a single price, you should expect roughly one month out of twelve to look statistically interesting purely by chance. We looked, and we found exactly one month that looked statistically interesting, and it cleared the threshold by one hundredth of a point, and it does not replicate in the first half of the record.
That is not a finding. That is the arithmetic of searching twelve boxes and being pleased when one of them contains something.
This is the same discipline problem as testing a strategy, which is why it belongs next to how to have an edge in trading. An edge you found by looking at many possibilities has to clear a much higher bar than an edge you predicted in advance, because the searching itself manufactures winners.
What the second half of the record is actually showing you
One honest complication, because leaving it out would make the seasonal case look weaker than it is and I would rather be accurate than persuasive.
Look again at the chart and you will notice that almost every month improved between the two eras. That is not twelve separate seasonal effects appearing at once. It is drift. Gold averaged 0.143 per cent a month from 1975 to 2000 and 0.888 per cent a month from 2001 to 2026. The second half of the record is a long bull market, and a rising tide lifts January and June alike.
Which tells you how to read any seasonality claim properly: a month only counts as seasonal if it beats the baseline of its own era, not if it beats zero. Measured that way, January was 0.018 percentage points better than its era's typical month in the first half, and 2.451 points better in the second. A supposedly permanent calendar effect that is a rounding error for twenty five years and then substantial for twenty five years is not describing the calendar. It is describing two different markets.
What this does and does not change
None of this says the seasons are meaningless. There are genuine physical rhythms in the gold market: jewellery demand runs on festival and wedding calendars, and refiners and vault operators have busy and quiet periods. Those are real, and they are part of why supply and demand move the price of gold at all.
What the measurement says is narrower and firmer. Whatever those rhythms do to the price, they are too small to be separated from ordinary monthly variation with fifty one years of evidence. That is not a claim about whether the effect exists. It is a claim about whether you can act on it, and you cannot, because you cannot tell it apart from noise even after half a century.
So the practical position is this, and it sits inside the larger job of protecting your capital when gold gets volatile. Do not size a position because of the month. Do not hold something that has stopped making sense because a chart says the month is usually kind. And be especially careful with the version of this idea that arrives in the group as a screenshot with no sample size, no confidence interval and no mention that eleven of the twelve bars cannot be told apart from zero.
If a month genuinely mattered as much as the charts imply, fifty one years would have been enough to prove it. It was not enough. That is your answer.
The useful habit underneath all of this is the one that evaluating your own trading performance also requires: before believing any pattern, ask how many years, how wide the interval, and whether it holds in the half of the data you did not look at first. Most market folklore does not survive those three questions, and the ones that do survive are worth a great deal more than the ones that do not.
Get the free Black Gold Market blueprint, a short document on protecting capital before you try to grow it, including how to tell a real pattern from a pattern you found by looking. One email, no spam, unsubscribe anytime.
Get the free blueprint →Frequently asked questions
Is gold price seasonality real or not?
Both answers are partly right, which is why the question causes arguments. Physical demand genuinely has a calendar. But measured against fifty one years of the LBMA benchmark, the difference between the best and worst calendar month is 2.429 percentage points, which is 0.46 of a single month's standard deviation. Eleven of the twelve months cannot be distinguished from zero at 95 per cent confidence. It may exist. It is not measurable enough to trade.
Which month has been strongest for gold?
January, at an average of 1.781 per cent across 51 years, with March weakest at minus 0.648 per cent. Both numbers come with the same warning: January finished higher in only 28 of those 51 years, and its advantage is entirely concentrated in the years after 2000. Knowing the ranking is not the same as being able to use it.
Why split the record into two halves?
Because it is the cheapest honest test available. A pattern caused by something structural should appear in both halves. A pattern caused by luck usually appears in one. January passes on the full record and fails the split, which is the outcome you expect when a result came from searching rather than from a cause.
Does the recent bull market not prove the seasonal effect is stronger now?
It proves gold drifted up faster after 2000, which lifted almost every month, not just the favoured ones. A month only counts as seasonal if it beats its own era's average, and on that basis January's advantage was 0.018 percentage points in the first era and 2.451 in the second. An effect that changes size by a factor of a hundred between halves is not a stable property of the calendar.
So should I ignore the seasonal charts completely?
Read them as history, not as a schedule. They describe what has already happened, which is interesting, and they carry no information about what a specific future month will do. The failure is not in looking at them. It is in sizing a position as though the month were evidence.
Where did these numbers come from?
All of them are my own arithmetic on the LBMA afternoon gold auction in US dollars, linked above, from 1 January 1975 to 24 September 2026, which is 620 consecutive month end to month end moves. Returns are logarithmic, months are matched only where consecutive, confidence intervals use the normal approximation at 1.96 standard errors, and the split is at the end of 2000. The stated limitation is that month end prices cannot see what happened inside a month, so this measures monthly outcomes and not intra month paths. No gold price level appears anywhere in this article.
About the author. Raphael writes Black Gold Market. He would rather measure a piece of market folklore and find nothing than repeat it because it sounds right, since the second habit is how accounts end up sized on things that were never there. Nothing in this article is a recommendation to trade, and no entry, stop or target discussed should be treated as a signal.