

What is the de dollarization trade, in the form the question usually arrives: somebody has told you the world is abandoning the dollar, that central banks are buying gold with both hands because of it, and that there is a position to take before the rest of the market notices. It is one of the most repeated stories in the gold world, and it is repeated most loudly by people who want you to buy something today.
The story is not a fabrication. Something real is happening. But the thing that is happening is slower, smaller and far more boring than the version you were sold, and the published numbers say so plainly. This piece does what I would want somebody to do for me: take the claim, find the primary sources that actually measure it, do the arithmetic in the open, and say what the numbers support and what they do not.
What is the de dollarization trade, as people actually mean it
Strip away the language and the claim has three links in a chain. First, the dollar is losing its place as the world's reserve currency. Second, the countries stepping away are putting the money into gold. Third, because of this, gold has a floor underneath it and a long move ahead of it, so you should be positioned now.
Each link needs to hold for the chain to carry weight. The useful thing is that the first two links are measurable. Somebody publishes numbers for both, quarterly, for free. So rather than argue about the third link, which is a forecast and therefore nobody's to prove, let me show you what the first two actually look like when you go and read them.
The reserve numbers, and where to find them yourself
The International Monetary Fund runs a dataset called Currency Composition of Official Foreign Exchange Reserves, known as COFER. It is the source everybody quotes, including the people telling you the dollar is finished. The Federal Reserve published a study drawing on it, The International Role of the U.S. Dollar, Post-COVID Edition, and its figures for the end of 2022 run like this.
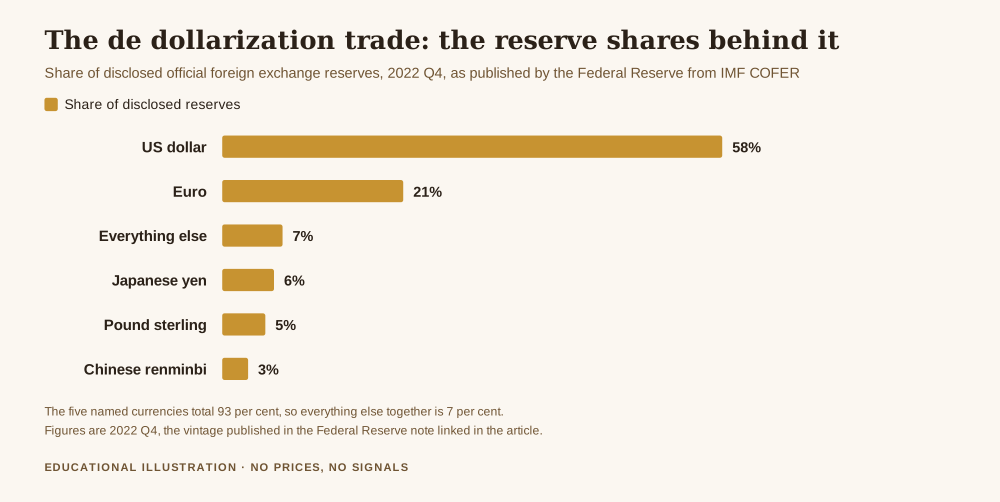
The dollar was 58 per cent of disclosed official reserves. The euro was 21. The yen was 6, sterling 5, and the renminbi 3. Those five add to 93, so every other currency on earth shares the remaining 7 per cent between them.
I should be straight with you about the vintage, because this is exactly the sort of thing that gets glossed over when a number is being used to sell something. Those figures are for the fourth quarter of 2022, from a note published in June 2023. They are not this morning's reading. I am using them because they are a primary source I can link you to and you can open, rather than a number somebody read out on a podcast. The direction of travel is the part that matters here, and that is measured over decades rather than quarters.
The arithmetic almost nobody does on the trend line
Here is the sentence that the whole narrative rests on, from that same Federal Reserve note: the dollar share "has declined from 71 percent of reserves in 2000". That is true, and it sounds dramatic. So let me do the division.
From 71 per cent to 58 per cent is 13 percentage points. Over the 22 years from 2000 to 2022, that is an average of 0.591 percentage points a year. In relative terms the dollar gave up 18.3 per cent of its starting share across more than two decades, which works out at about 0.9 per cent of itself per year.
Now run that forward, which is the step the story never takes. At that same average pace, the dollar reaches 50 per cent of reserves in about another 13 and a half years, so around 2036. It reaches 40 per cent around 2052. It reaches zero in the year 2120. I am not predicting any of those dates, and a straight line is a crude tool for a process like this. That is the point. A straight line is the most generous possible reading of the trend, and even the generous reading describes something that moves at the speed of a glacier.
The renminbi arithmetic is starker still. For the renminbi to occupy the dollar's place it would have to multiply its share by 19.3 times. If it captured every single percentage point the dollar surrendered, at the rate the dollar has been surrendering them, closing a 55 point gap would take 93 years.
None of this says the shift is unreal or unimportant. It says the shift is generational, and a generational shift is not a trade. Those are different categories of thing, and conflating them is how people end up holding a position for a story that will outlive them.
The gold half of the story, which is where it gets interesting
The second link in the chain is the one about central banks buying gold, and this is where the narrative has its strongest material. Central banks genuinely have been accumulating. The World Gold Council publishes the figures quarterly in Gold Demand Trends, and the central bank section of the Q2 2026 report gives numbers to 30 June 2026.
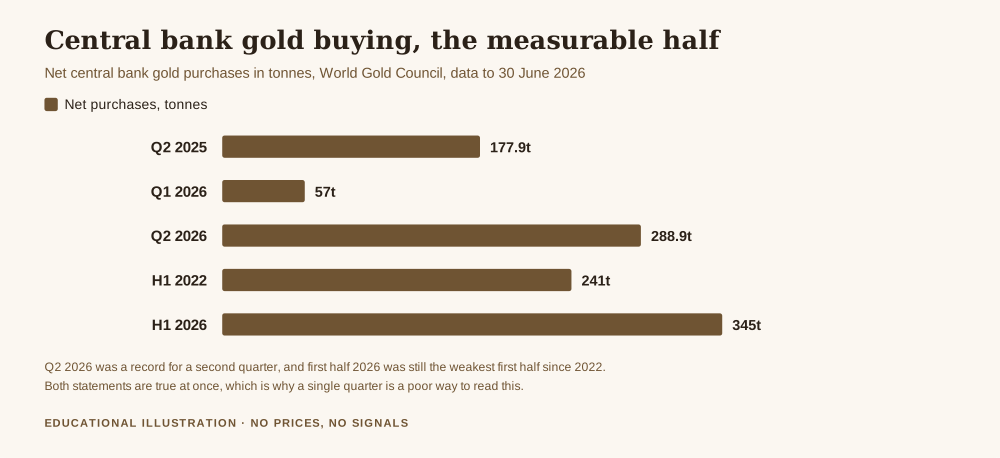
Net purchases in the second quarter of 2026 came to 288.9 tonnes. Against 177.9 tonnes in the same quarter a year earlier, that is a rise of 62.4 per cent, and the Council calls it a record high for a second quarter. If you wanted a headline for the de dollarization story, that is your headline.
Except the first quarter of 2026, revised, was 57 tonnes. The second quarter was 5.1 times the first. And the two together give a first half of 345 tonnes, which the Council notes was the lowest first half since 2022, when it was 241 tonnes.
Sit with that for a second, because it is the most useful thing on this page. The same six months of data support "record quarterly central bank buying" and "weakest first half in four years". Both sentences are accurate. Which one you hear depends entirely on who is talking to you and what they want you to do next.
One country was nearly a fifth of it
There is a further detail that the aggregate hides. The National Bank of Poland was the largest buyer in the quarter, adding 51 tonnes and taking its holdings to 632 tonnes by the end of June.
Fifty one tonnes out of 288.9 is 17.7 per cent. Close to one fifth of all net central bank gold buying on the planet, in a record quarter, was one European central bank continuing a programme it had been running for years. Meanwhile the Council records Russia as the only sizeable seller in the quarter, after heavy first quarter selling by Turkey, Russia and Azerbaijan had dragged the year to date figure down.
This is what "the world is de dollarizing into gold" looks like when you open it up. It is not a bloc. It is a few dozen institutions with unrelated domestic reasons, some buying, some selling, and the net figure bouncing around by a factor of five from one quarter to the next. Poland's reasons for holding more gold are Poland's. They are not a signal about the dollar, and they are certainly not a signal about your account.
Why the chain does not reach your screen
Assume both measurable links hold. The dollar is slowly losing reserve share, and central banks are net buyers of gold over time. The third link still has to carry the weight, and it is the weakest of the three.
A trend that moves 0.591 percentage points a year is already in the price of everything, because it has been visible to every institution on earth for 25 years. There is no edge in knowing a thing that is published quarterly and discussed constantly. If a shift is slow, public and universally known, the market has had decades to absorb it, and whatever gold does next week will be driven by the things that drive it next week, which is a subject I have written about in how the US dollar affects the price of gold.
The deeper problem is that "de dollarization" is not a position. You cannot buy it. What you can buy is gold, and if you buy gold because of a 93 year currency transition, you have taken on all of gold's ordinary week to week behaviour while telling yourself you are exposed to something else. When the position moves against you, as it will, the story offers you no information about whether to stay. That is the real damage a macro narrative does to an account. It is not that it is wrong. It is that it cannot be falsified on any timescale that matters to you, so it quietly removes your ability to change your mind.
What to do with a claim like this
The habit I would rather you take from this than any particular number is the sequence I used. Someone makes a macro claim. Ask which published series would measure it. Find out who publishes that series and go to them directly, not to the person quoting them. Then do the division yourself, because the division is almost always where the story falls apart, and it is almost never done in public.
It took me under an hour to do that here, with two free sources and a calculator. It turned an urgent story into an accurate and much less urgent one. That is the same muscle that tells you whether a central bank moving metal between vaults means anything, which I went through in why are countries repatriating gold, and the same one behind knowing what gold reserves actually are before forming a view about them.
Get the free Black Gold Market blueprint, a short document on protecting capital and on checking a claim against the source before you trade on it. One email, no spam, unsubscribe anytime.
Get the free blueprint →Frequently asked questions
What is the de dollarization trade in one sentence?
It is the idea that the dollar's decline as a reserve currency is pushing central banks into gold, and that you can position for it. The first two parts are measurable and partly true, and the third does not follow from them at any useful speed.
Is the dollar really losing reserve share?
Yes, slowly. The Federal Reserve note cited above puts it at 58 per cent of disclosed reserves in 2022, down from 71 per cent in 2000. That is 0.591 percentage points a year on average, which is my own arithmetic from those two published figures.
Are central banks buying gold at a record pace?
It depends which window you pick, and that is the honest answer rather than an evasive one. The second quarter of 2026 was a record for a second quarter at 288.9 tonnes, while the first half of 2026 at 345 tonnes was the weakest first half since 2022. Both come from the same World Gold Council report.
Will the renminbi replace the dollar?
Nothing in the reserve data points that way on any timescale a trader cares about. It held 3 per cent of disclosed reserves against the dollar's 58, so it would need to multiply its share more than 19 times to draw level.
Does central bank buying put a floor under gold?
Central banks have been net buyers over recent years, which is a genuine source of demand. A floor is a different claim, and the quarterly figures swinging from 57 to 288.9 tonnes show that this demand is not steady enough to be relied on as one.
So is the whole story nonsense?
No, and I would be as suspicious of that conclusion as of the original claim. The reserve shift is real and the gold buying is real. What is not real is the part where either of them tells you what to do with a position this month.
Where Black Gold Market fits
Where Black Gold Market fits
Black Gold Market is a free journal about reading gold and protecting capital, written for people who would rather check a primary source than be told what to think. Nothing here is sold on a promise of returns, and there is no signal service. The free blueprint is a short document on protecting capital and on the unglamorous checks that decide whether a claim holds up. The piece underneath all of it is how to protect your capital when gold gets volatile.
About the author. Raphael writes Black Gold Market. He spent years nodding along to macro stories that sounded too big to check, until he started checking them and found that the checking took about an hour. What matters to him is the level, the context, and the risk, in that order.
Sources and method. Reserve currency shares are from the Federal Reserve FEDS Note The International Role of the U.S. Dollar, Post-COVID Edition, published 23 June 2023, reporting figures for the fourth quarter of 2022 and sourced there to IMF COFER, both linked above. Central bank gold tonnages are from the World Gold Council's Gold Demand Trends for the second quarter of 2026, data to 30 June 2026, linked above. The percentage point pace, the relative decline, the projection dates, the renminbi multiple and Poland's share of the quarter are all my own arithmetic on those published figures, shown in the text so you can repeat it.
Disclaimer. This article is educational content about reserve statistics and central bank gold holdings. It is not investment advice, not a recommendation, and not a forecast. Nothing here is personal advice, and no entry, stop or target discussed should be treated as a signal. No absolute gold price appears anywhere in this article. Figures describe the periods stated and will change. Decide your own risk, and never trade money you cannot afford to lose.
Start here, it's free
A trend measured in decades is not a position you take this week.
Follow along on Telegram for daily gold analysis with the level, the context and the risk written out, so you can judge the reasoning instead of copying a number.
Join Black Gold Market on Telegram No guaranteed profit. No pressure to copy anything blindly.Keep reading
What Are Gold Reserves
What the word reserves covers before you form a view about who is buying.
MasterWhy Are Countries Repatriating Gold
Moving metal between vaults changes the address, not the ownership.
GrowHow the US Dollar Affects the Price of Gold
The mechanism that actually operates week to week.
One step first
Where should we send the Sustainable Trader's Blueprint?
Leave your email and we will send the free Blueprint, then take you straight to the Telegram channel.
No cost and no obligation. Educational only, not financial advice, and nothing here promises a return. Unsubscribe any time in one click.