

Someone posts a screenshot of a good week and the first question underneath is always how much did you make. It is the wrong question, and the person asking it is usually the one who will ask what is r multiple in trading six months later, after a year of records that cannot be compared with each other.
Money is a poor unit for reviewing decisions, because it moves for reasons that have nothing to do with the quality of the decision. The same trade, taken with the same reasoning at the same moment, produces a different number depending on how large your account happened to be that month. Reviewed in money, a good decision on a small account looks worse than a careless one on a large account.
R fixes that. It is a small idea, it takes about ten minutes to adopt, and it quietly changes what you are able to learn from your own record. There is no gold price anywhere in this article, because R is a ratio and does not need one.
What Is R Multiple in Trading, Defined Properly
One R is the amount you put at risk on a trade, decided before you enter. If you are willing to lose a fixed slice of your account on a position, that slice is one R for that trade.
The R multiple of a closed trade is its result divided by that risk. Lose the full amount you planned to lose and the trade was minus 1R. Make two and a half times it and the trade was plus 2.5R. Cut a loser early for half the planned loss and it was minus 0.5R. That is the whole mechanism, and it is deliberately boring.
Two things follow immediately. The first is that R only exists if you defined your risk before entering. A trade taken without a predetermined exit has no denominator, so it has no R multiple, only a result. This is why traders who adopt R often report that the measurement changed their behaviour before it changed their record: you cannot record the number without first deciding the risk.
The second is that R is unitless. It survives a change in account size, a change in currency, a change in instrument. A plus 2R trade in March and a plus 2R trade in November are the same quality of outcome even if the amounts differ by a factor of five.
Why Counting Money Hides the Thing You Need to See
Take a ten trade sequence and write it in R: plus 2, minus 1, minus 1, plus 3, minus 1, minus 1, minus 1, plus 1.5, minus 1, plus 2.5. That is four winners and six losers, a 40 percent win rate, and a total of plus 3R across the ten trades, which is an average of plus 0.3R per trade.
Now express the same ten decisions in money. On an account where one R was set at twenty units of currency, the sequence made sixty units. On an account where one R was a hundred, it made three hundred. Same decisions, same skill, same order, and the money column reports two completely different stories. Only one of those two columns is telling you about your trading.
This is why the honest answer to how much did you make is usually a question about the account rather than about the method. It is also why a run of results can look like progress while the decisions behind them are getting worse, which happens whenever size grows faster than judgement.
Note what the sequence above does not prove. It is an arithmetic example on chosen numbers, not a record, not a claim and not something anyone should expect to reproduce. Its only job is to show that the same decisions produce different money and identical R.
Win Rate Is Meaningless Without R, and Here Is the Proof
The most repeated number in retail trading is the win rate, and on its own it carries almost no information. R is what completes it.
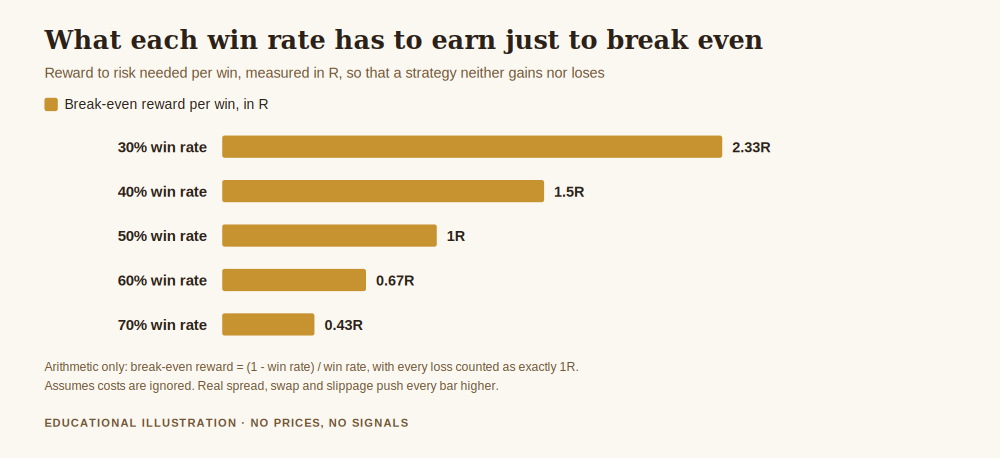
The break-even arithmetic is simple enough to do in your head. For a strategy to break even, the average win in R times the win rate must equal the average loss in R times the loss rate. Hold the average loss at exactly 1R and the required reward per win becomes one minus the win rate, divided by the win rate.
Run that across the range, as in the chart above. A 30 percent win rate needs to average 2.33R per win just to stand still. A 40 percent win rate needs 1.5R. At 50 percent the requirement is exactly 1R. At 60 percent it falls to 0.67R, and at 70 percent it is 0.43R.
Read that in the other direction and it becomes useful. A strategy advertising a 70 percent win rate is losing money if its winners average less than 0.43R, which is an easy thing to do accidentally by taking profits early. A strategy winning 30 percent of the time is making money if its winners average more than 2.33R. Neither statement can be evaluated from the win rate alone, which is exactly why the win rate is the number most often quoted at you.
Those figures assume costs are zero. Spread, commission and slippage all come out of the winners and add to the losers, so every bar in that chart sits higher in real trading than it does in the arithmetic. A method sitting a fraction above break-even on paper is usually below it in an account.
Expectancy, Which Is Just R With the Averages Filled In
Once results are in R, expectancy stops being jargon. It is the average R multiple across all your trades, winners and losers together.
In the ten trade sequence above, the four winners averaged plus 2.25R and the six losers averaged minus 1R. Multiply and add: 0.4 times 2.25, minus 0.6 times 1, which is plus 0.3R per trade. That matches the total, as it must, and the useful part is that it now decomposes. Expectancy can be improved by winning more often, by winning larger, or by losing smaller, and the three are separate problems with separate solutions.
Most people discover their real problem sits in the third column. Losses that run past 1R because the stop was moved, or because there was not one, are the most common reason a record that should be positive is not. In R that shows up instantly as an average loss of 1.4R when it was supposed to be 1R, which is the kind of thing money columns hide for months.
Why This Matters More Than It Sounds
There is a reason to be rigorous about measurement in this particular market, and it is not motivational.
When the European Securities and Markets Authority introduced its product intervention measures for contracts for difference, it published the supervisory finding that prompted them. Analyses by national regulators across EU jurisdictions showed that 74 to 89 percent of retail accounts typically lose money, with average losses per client ranging from 1,600 to 29,000 euros.
Sit with the width of that range for a moment. The difference between 1,600 and 29,000 is not a difference in market conditions, because these clients traded the same markets. It is a difference in how much was risked per decision. The same measures capped retail leverage at 20 to 1 for gold and imposed a margin close out at 50 percent of required margin, which are both, in effect, external limits on R for people who had not set their own.
That is the real argument for this unit. If your average loss is not a fixed, known quantity, you are somewhere in that distribution without knowing where, and the only way to find out is the expensive way.
How to Start Using R This Week
Adding R to a journal takes one column and no new software.
Before each trade, write down the amount you are prepared to lose if the exit level is reached. That is your 1R for that trade, recorded in advance and never edited afterwards. When the trade closes, divide the result by that number and write the R multiple next to it. That is the entire process.
After thirty trades you can compute three things that were previously invisible: your win rate, your average win in R, your average loss in R. Check the average loss first. If it is materially worse than 1R, the problem is not your entries and no amount of chart study will fix it, because you are not losing what you decided to lose.
Then check the average win against the break-even requirement for your win rate from the chart above. If it sits below, the method as you are executing it does not yet work, regardless of how the money column looks over any particular month. That is unwelcome information and it is much cheaper to receive at thirty trades than at three hundred.
One caution about sample size. Thirty trades tells you about your discipline, particularly whether losses are staying at 1R, which is a measure of behaviour rather than of edge. It does not establish that a method has an edge. Short sequences produce impressive and misleading runs in both directions, and treating a good month in R as proof is the same mistake as treating a good month in money as proof, just in better units.
What R Does Not Do
R does not tell you where to enter, and it does not make a poor method profitable. A strategy with negative expectancy measured in R is simply a strategy with negative expectancy, described more precisely.
It also does not remove the sting of a loss. Minus 1R and a real amount of money leaving your account are the same event, and calling it minus 1R does not make it comfortable. What the unit does is keep the loss the size you chose, and give you a record in which this month and last month can honestly be compared.
Protect comes first here, as usual. Defining 1R is a capital protection decision that happens to produce a measurement system as a side effect, and that order matters. The measurement is useful. The fixed risk it depends on is what keeps you in the market long enough for any of it to add up.
Get the free Black Gold Market blueprint, a short document on fixing your risk per trade before you measure anything else, including the break-even arithmetic used on this page. One email, no spam, unsubscribe anytime.
Get the free blueprint →Frequently Asked Questions
What is r multiple in trading, in one sentence?
It is a trade's result divided by the amount you decided to risk on it, so a trade that makes two and a half times the planned risk is plus 2.5R.
Is R the same as risk to reward ratio?
They are the same unit used at different moments. Risk to reward is the ratio you plan before entering, the target expressed against the risk. The R multiple is what the trade actually delivered once it closed. Plans and outcomes differ, and keeping both columns is how you find out by how much.
What should one R be as a percentage of my account?
That is a personal decision about risk tolerance and not something an article can set for you. What matters for this method is that the number is decided in advance and stays consistent, because an R that changes with your mood makes the whole record incomparable again.
How do I record a trade where I moved the stop?
Against the original risk, always. If you planned to lose one unit and lost 1.6 because the exit was moved, that trade is minus 1.6R. Recording it against the revised level would erase precisely the behaviour you most need to see.
What about a trade I closed early for a small gain?
It is a small positive R, perhaps plus 0.3R, and those belong in the record as they are. A pattern of plus 0.3R winners alongside minus 1R losers is one of the most common reasons a high win rate produces a shrinking account.
Where did the numbers in this article come from?
The retail loss range, the leverage cap and the margin close out rule are quoted from the ESMA measures linked in the text, checked live before publication. Every other figure is arithmetic from assumptions stated on the page: break-even reward equals one minus the win rate divided by the win rate, with every loss counted as exactly 1R and costs excluded. The ten trade sequence is a chosen example, not a record, and none of it is a prediction.
Where Black Gold Market Fits
Black Gold Market is free to follow. Daily XAU/USD analysis with the level, the context and the risk stated before the trade, losing days included, on Telegram. There is a free blueprint for anyone who wants the capital protection material in one place, and an optional Kit for people who want the full method. Nothing here promises a profit, and nothing here is a signal service.
Measurement belongs to Protect, because you cannot defend capital you are not counting properly. How to protect your capital when gold gets volatile is the pillar this article sits under, how do you calculate risk reward ratio covers the planning side of the same unit, what is expectancy in trading takes the averages further, and position sizing so one trade cannot hurt you is how 1R gets set in the first place. More about who writes this is on the about page.
About the author. Raphael writes Black Gold Market. He works on the part of this business that happens before the entry, the level, the context, and the risk, and he has a particular interest in the measurements that make a year of trading reviewable rather than merely memorable. Nothing in this article is a recommendation to trade, and no entry, stop or target discussed should be treated as a signal.
Disclaimer: This article is general educational content about measuring trading results, risk units and expectancy in retail gold trading. It is not financial advice, not investment advice and not a recommendation to buy, sell or use any product, venue or firm. Regulatory wording is quoted from the source linked in the text and may change. Trading leveraged products carries a substantial risk of loss and most retail accounts lose money. Figures are illustrative calculations from stated assumptions, not predictions or performance claims.