

How do you calculate risk reward ratio? You divide the distance from your entry to your target by the distance from your entry to your stop. That is the whole formula, it takes four seconds, and it is the least interesting part of the subject. The interesting part is what the answer quietly commits you to, and almost nobody works that out before they commit.
Because a ratio is not a result. It is a shape. Two traders with exactly the same edge, the same expectancy, the same long run outcome, can have completely different years depending on which shape they chose, and the one who chose the prettier ratio is usually the one who quits. I ran the arithmetic on that, then measured how far gold actually moves in a day, because a ratio drawn against a stop the market steps over every session is not a ratio at all.
How Do You Calculate Risk Reward Ratio, the Formula Itself
Take the price you would enter at. Measure down to where your stop sits, that distance is your risk, and call it 1. Measure up to where your target sits, that distance is your reward. Divide the second by the first and you have R.
A worked example, in units of price so it applies to any instrument and any account size. Your stop is 8 units away from entry. Your target is 24 units away. R is 24 divided by 8, which is 3, and you would write it 1:3. One unit of risk, three units of reward.
That is it. No adjustment for how confident you feel, no rounding in your favour, and critically, the measurement is taken before the trade, from levels you chose for reasons you can state. A ratio calculated after the fact, by moving the target to wherever the price happened to stop, is not a calculation. It is a description.
Two things people leave out and should not. Costs belong on the risk side: spread and commission widen your real risk without widening your reward, so a 1:3 on paper is something slightly less than 1:3 in the account. And the ratio says nothing whatsoever about how likely either outcome is. That is a separate number, and it is the one that decides whether you make money.
The Number Your Ratio Quietly Commits You To
Every ratio carries a win rate you have to beat, and it follows from the ratio alone. Breakeven win rate is 1 divided by (1 plus R):
- at 1:1 you need to win 50 percent of the time to break even
- at 1:2 you need 33.33 percent
- at 1:3 you need 25 percent
- at 1:5 you need 16.67 percent
This is where the popular advice comes from. Take 1:3 and you only need to be right a quarter of the time, which sounds like it removes the pressure. It does not remove the pressure, it moves it. What it actually says is that at 1:3, being wrong three times in a row is the normal case rather than a crisis, and you have signed up to a method where most of your trades are losses by design.
Knowing that in advance is the difference between a system and a disappointment.
What the Prettier Ratio Actually Costs
Here is the test that settles the argument. I simulated four traders. Every one of them has an identical edge: an expectancy of plus 0.10R per trade, which is a modest, realistic, genuinely profitable number. The only difference between them is the shape. The first takes 1:1 and wins 55.0 percent of the time. The second takes 1:2 and wins 36.7 percent. The third takes 1:3 and wins 27.5 percent. The fourth takes 1:5 and wins 18.3 percent. By construction they all make the same money in the long run.
Across 100,000 simulated runs of 200 trades each, this is the losing streak each of them sits through:
- at 1:1, the typical worst streak is 6 losses in a row, and one run in twenty reaches 9
- at 1:2, the typical worst streak is 10, and one run in twenty reaches 15
- at 1:3, the typical worst streak is 13, and one run in twenty reaches 21
- at 1:5, the typical worst streak is 19, and one run in twenty reaches 31
One run in a hundred is worse again: 11 losses at 1:1, and 39 in a row at 1:5.
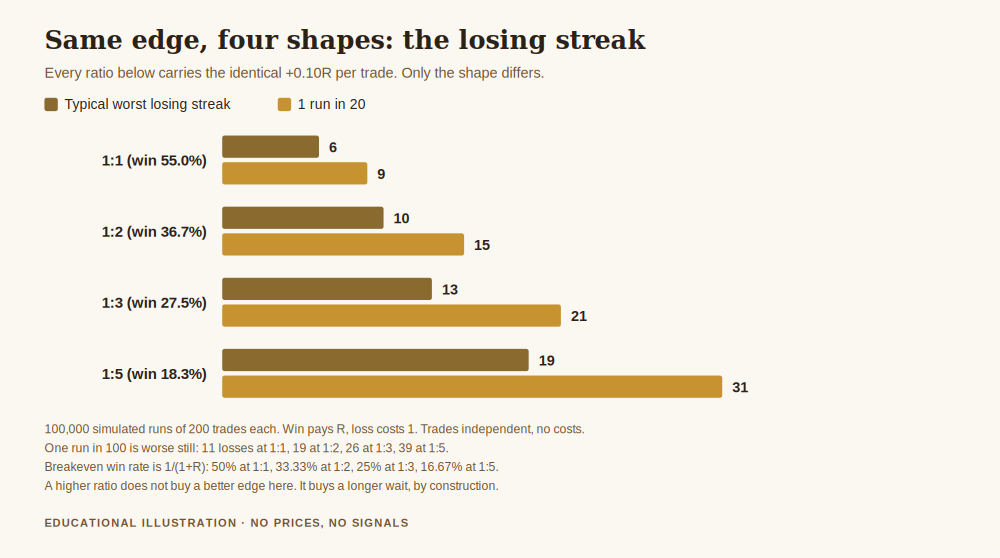
Nineteen losses in a row, as the ordinary case, from a trader with a perfectly good edge. Not the bad case. The typical one. And a one in twenty year hands them thirty one.
Now ask yourself honestly what you would do on loss number fourteen. Most people do not sit still. They shorten the target to get a win on the board, which converts their 1:5 into a 1:1 without the win rate that makes a 1:1 work, and that is the moment the edge dies. It was not the market that took it, and it was not the ratio. It was choosing a shape without reading the bill.
The Drawdown That Comes Attached
The streak is what you feel. The drawdown is what it does to the account. Measured in R across the same simulations:
- at 1:1, the typical worst drawdown in a 200 trade run is 10R, and one run in twenty reaches 19R
- at 1:2, 16R typical, 31R at one in twenty
- at 1:3, 20R typical, 40R at one in twenty
- at 1:5, 28R typical, 54R at one in twenty
Multiply by whatever you risk per trade to get the number in your own account. At 1 percent of equity per trade, the 1:5 trader's typical worst patch is a 28 percent drawdown, and one year in twenty takes them past half the account, all while running an edge that works.
There is a second figure worth more than any of these. After 200 trades, the 1:1 trader is still showing a loss in 6.91 percent of runs. The 1:5 trader is still showing a loss in 28.75 percent of runs. Same edge, same number of trades. More than one time in four, the higher ratio trader finishes two hundred trades with nothing to show for a method that genuinely works, and concludes it does not.
Where the Stop Has to Sit for the Ratio to Be Real
All of the above assumes your stop is a real level. Most broken ratios are broken here, before any of the probability matters.
You can manufacture any ratio you like by moving the stop closer. Halve the stop distance and your 1:2 becomes a 1:4 on the diagram, at no apparent cost. The cost is entirely in the fill rate, and it is measurable. From the published LBMA gold benchmark, afternoon fix, across 2,662 daily moves from 4 January 2016 to 14 August 2026:
- the median absolute daily move is 0.4998 percent
- the 75th percentile is 0.9671 percent
- the 90th percentile is 1.5722 percent
- the 95th percentile is 2.0951 percent
- the largest single move in the sample is 7.8289 percent
Now place a stop as a fraction of one ordinary day and count how often a single session travels at least that far:
- a stop at a quarter of a median day, 0.125 percent, is reached by 84.9 percent of sessions
- a stop at half a median day, 0.250 percent, by 70.8 percent
- a stop at one median day, 0.500 percent, by 50.0 percent
- a stop at two median days, 1.000 percent, by 23.7 percent
A stop tucked inside the market's ordinary daily breathing does not give you a 1:5 trade. It gives you a 1:5 diagram and a very high probability of being removed before the market has done anything unusual at all. And note what that does to the arithmetic in the previous section: the ratio on your chart says 1:5, the win rate you get is the win rate of a coin that is weighted against you, and no amount of discipline rescues a shape that was never real.
Which is why the order matters. The stop goes where the idea is wrong, decided by the level and the context. Then you measure the ratio. If the ratio that comes out is poor, the answer is to skip the trade, not to move the stop until the number improves.
What This Does Not Say
It does not say low ratios are better. A 1:1 trader needing 55 percent has their own problem, and it is a hard one: a high win rate is fragile, and it degrades the moment costs and slippage arrive. It does not say these streak figures will be your streaks, because the model assumes independent trades and identical setups, and real trading clusters, both in the market and in your own behaviour. Clustering makes streaks longer, not shorter.
It does not say the gold figures predict anything. Ten and a half years of a public benchmark is history. And it certainly does not say any of these numbers is a target. There is no promise here of an outcome, only a description of the shape you are choosing.
What it does say is that "how do you calculate risk reward ratio" has an easy answer and an expensive one. The easy answer is the division. The expensive answer is the wait you have agreed to, and you should price that before the trade rather than discover it on loss fourteen.
Get the free Black Gold Market blueprint, a short document for choosing a ratio you can actually sit through, and sizing it so the streak that comes with it stays survivable. One email, no spam, unsubscribe anytime.
Get the free blueprint →Frequently Asked Questions
What is a good risk reward ratio?
The one whose breakeven win rate you can actually beat, with a stop placed where your idea is wrong. That is a genuine answer rather than an evasion: a 1:2 you can hit 40 percent of the time is worth far more than a 1:5 you hit 12 percent of the time, and the second one looks better in every screenshot.
How do you calculate risk reward ratio when you scale out of a position?
Weight it. Work out the reward of each portion against the full initial risk, then add them. Taking half off at 1:1 and letting the rest run to 1:4 gives you a blended ratio of about 1:2.5, not 1:4. Reporting the runner's ratio and quietly ignoring the half you closed early is the most common way traders overstate their own numbers.
Does a higher ratio mean a better trader?
No. It means a different shape, with a longer wait attached. The figures above show four traders with identical edges and wildly different experiences, and the one with the highest ratio is the most likely to be sitting in a drawdown when you ask them how it is going.
Should I include the spread in the calculation?
Yes. Costs widen the risk without widening the reward, so they always push the true ratio below the drawn one. On a tight stop the effect is large, which is another reason very tight stops flatter the diagram and punish the account.
How many trades before I know my ratio is working?
More than feels reasonable. At 1:3 the typical worst losing streak inside 200 trades is 13, so a run of ten losses tells you almost nothing on its own. Judge the process against the record, not against the last handful of outcomes.
Where did these streak and drawdown figures come from?
I computed them, from 100,000 simulated runs of 200 trades for each ratio, with win rates set so that every configuration carries the same plus 0.10R expectancy. Trades are independent, wins and losses are full size, and there are no costs. The full assumptions are in the disclaimer below.
Where This Leaves You
The formula is the easy half, and it is the half every article stops at. Reward distance divided by risk distance, measured before the trade, costs on the risk side.
The half that decides whether you are still trading the method next year is the bill attached to your answer. Choose 1:5 and you have chosen a typical worst streak of 19, a typical drawdown of 28R, and better than a one in four chance of finishing two hundred trades with nothing to show for a working edge. That is not an argument against 1:5. It is an argument for knowing the price before you agree to it, and for sizing small enough that the price stays payable.
Protect comes first here, as usual. Decide where the idea is wrong, size so the streak cannot end you, and only then look at what ratio the trade is offering. Position sizing so one trade cannot hurt you covers the sizing half, how to have an edge in trading covers how long the record needs to be before it can answer anything, and how to protect your capital when gold gets volatile is where the whole habit is written out.
About the author. Raphael writes Black Gold Market. He works on the part of this business that happens before the trade, the level, the context, and the risk, and on the conviction that a method you can follow through a quiet quarter is worth more than a better one you cannot.
Disclaimer: This article is general educational content about a calculation and its consequences. It is not financial advice and not a suggestion to open any particular position. Trading gold, CFDs and leveraged products carries a high risk of losing money rapidly. No entry, stop or target discussed should be treated as a signal. The streak, drawdown and finishing figures were computed by me from 100,000 simulated runs of 200 trades for each ratio, with win rates set so every configuration carries an identical expectancy of plus 0.10R per trade, wins paying R and losses costing 1, trades independent, no costs, no partial exits and no slippage; real trading is worse on every one of those counts, and clustering makes streaks longer than an independent model shows. They describe a model, not any person's results, and they are not a target. The daily move figures were computed by me from the published LBMA gold benchmark, afternoon fix, across the 2,662 steps between the 2,663 published sessions from 4 January 2016 to 14 August 2026, using closing benchmark values only, with no intraday data and no dealing costs. No gold price is quoted anywhere in this article and no trading results are represented. Past behaviour of a public benchmark is not a prediction.