

Every few years a headline announces that the world has dug up most of its gold and the rest is running out. Then the price moves for an unrelated reason and nobody mentions it again for a while. So let us answer the question properly rather than dramatically: what is peak gold, who says we have reached it, and what do the published production numbers actually show when you line them up side by side.
I am going to do this the way I do everything in this journal. The production and reserve figures come from the United States Geological Survey, which publishes them every year in a two page summary anybody can download. The arithmetic on top of those figures is mine and I show it. There is no gold price anywhere in this article, because the question of how much metal comes out of the ground is a separate question from what a contract on that metal is worth today.
What is peak gold, stated plainly
Peak gold is the idea, borrowed from the older argument about peak oil, that global gold mine production reaches a maximum and then declines permanently. Not because the metal vanishes, but because the easy deposits get mined first, and what is left is deeper, lower grade, more remote, more expensive and slower to permit.
Notice what the claim does not say. It does not say the world runs out of gold. Gold is close to indestructible, so almost every ounce ever mined still exists in some form, in vaults, in jewellery, in the back of a drawer. Peak gold is a statement about the rate of new supply, not about the stock of existing metal. That distinction does most of the work in this article.
It is also a claim you can check. Mine production is measured and published annually. So instead of arguing about the theory, we can look at the record.
The production record, six years of it
The USGS publishes a gold summary each February as part of its Mineral Commodity Summaries. Each edition gives world mine production for the previous year and an estimate for the year just ended. Stack three editions and you get a run of years from one consistent source.
From the 2021 edition: world mine production was 3,300 tonnes in 2019 and an estimated 3,200 tonnes in 2020. From the 2025 edition: 3,250 tonnes in 2023. From the 2026 edition, published in February 2026: 3,280 tonnes in 2024 and an estimated 3,300 tonnes in 2025.
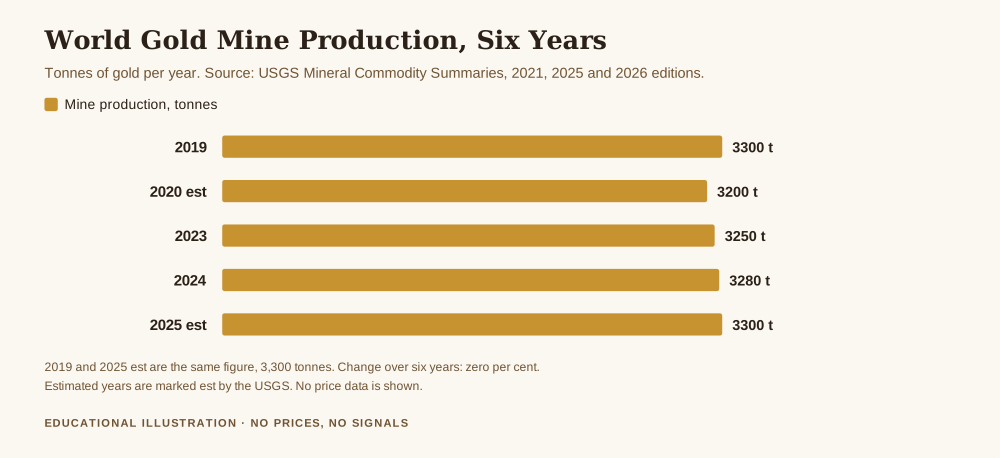
Run the comparison that matters. In 2019 the world mined 3,300 tonnes. In 2025 the world is estimated to have mined 3,300 tonnes. Six years apart, the same number. That is a change of zero per cent.
This is the honest answer to the question, and it is less exciting than either camp would like. Production has not collapsed. It has also not grown. It has sat on a plateau, wobbling by one or two per cent in each direction, for most of a decade. If you define peak gold as a permanent decline that has already begun, the global figures do not show it. If you define it as the end of growth, the global figures are entirely consistent with it.
One point of context from the World Gold Council's mine production data, updated in June 2026: China was the largest producing country in 2025 and accounted for roughly a tenth of global output. There is no single swing producer here. Mining happens on every continent except Antarctica, and the plateau is the sum of a great many national trends pulling in different directions.
Why reserves went up while output stayed flat
Here is where most peak gold arguments quietly go wrong, and it is worth slowing down for.
The same USGS summaries publish world reserves alongside production. In the 2021 edition, world reserves were 53,000 tonnes. In the 2026 edition, world reserves were 66,000 tonnes. That is an increase of 24.5 per cent on my arithmetic, over a period when annual production did not grow at all.
How can the amount of gold left in the ground grow by a quarter while the amount coming out each year stands still? Because a reserve is not a geological fact. It is an economic one. A reserve is the part of a known deposit that can be extracted profitably under current conditions. Raise the price, improve the processing technology, or finish the drilling programme that converts a resource into a measured reserve, and tonnage moves into the reserve column without a single new atom of gold appearing anywhere.
The 2026 edition says so directly: reserves for Australia, Brazil, China, Peru and the other countries grouping were revised based on company and government reports. Revised, not discovered.
And the definitions are slippery enough to matter. The USGS lists Australian reserves at 13,000 tonnes, then adds a footnote saying that reserves compliant with the Joint Ore Reserves Committee code, the stricter industry standard, were 4,500 tonnes. The same country, the same year, the same source, and the two figures differ by a factor of 2.9 depending on which definition you accept. Anybody who quotes a reserve number at you without saying which standard it follows is not telling you as much as they appear to be.
What a twenty year reserve life does and does not mean
The number that gets passed around most is reserve life, and it is easy to compute. Take world reserves and divide by annual production.
Using the 2026 edition figures, 66,000 tonnes of reserves divided by 3,300 tonnes a year gives exactly 20.0 years. That is my arithmetic on the USGS numbers, with no adjustment and no forecast in it.
Twenty years sounds alarming, and it is quoted as though it were a countdown. It is not. It is a ratio of two moving numbers, and we have just watched one of them move. Five years ago the same calculation on the 2021 edition gave 53,000 divided by 3,200, which is about 16.6 years. Five years passed, roughly 16,000 tonnes came out of the ground, and the ratio got longer rather than shorter. A countdown that runs backwards is not a countdown.
The resource figures make the same point from another direction. The 2026 summary notes that an assessment of United States gold resources indicated 33,000 tonnes, split into 15,000 tonnes identified and 18,000 tonnes undiscovered, and adds that American resources are only a small portion of the global total. Resources are a looser category than reserves, and undiscovered resources are a modelled estimate rather than a bankable asset. But the gap between 66,000 tonnes of global reserves and that scale of resource says something simple: the constraint is cost and time, not the absence of metal.
Where the decline is actually visible
Global output is flat. That does not mean nothing is happening, because the national figures move a great deal and some of them move in one direction only.
United States mine production, from the same two editions: 200 tonnes in 2019, and an estimated 160 tonnes in 2025. That is a fall of 20 per cent in six years. The 2026 summary adds that Nevada accounted for about 64 per cent of domestic production and Alaska about 22 per cent, and that the top 25 operations yielded roughly 94 per cent of American mined gold. A national trend that concentrated is really the trend of a short list of mines.
Australia went from 325 tonnes in 2019 to an estimated 280 tonnes in 2025, a fall of 13.9 per cent. China, the largest producer, went from 380 tonnes to an estimated 380 tonnes, dead flat. Russia went from 305 to an estimated 310. The 2026 edition puts China, Russia, Australia, Canada and the United States together at 41 per cent of estimated global production, which leaves the majority of world supply spread across everybody else.
So the picture underneath the plateau is a set of mature mining countries slowly producing less, offset by output elsewhere. That is a real and consequential pattern. It is also not the same story as the world running out of gold, and it should not be sold as one.
What this means if you trade gold rather than mine it
Honest answer first: on any timeframe you are likely to trade, almost nothing.
Mine supply is slow. It changes by one or two per cent a year, it is published annually in arrears, and it is already known to everybody who prices gold professionally. Nothing in a dataset that updates once a year tells you anything about the next few hours or the next few weeks.
What the exercise is genuinely good for is calibration, and that is worth more than it sounds. The peak gold story is the kind of claim that arrives attached to something somebody wants to sell you. It has a real foundation, which is what makes it effective, and it is routinely stretched into a conclusion the data does not support.
Work through it once and you have a template for the next one. Three steps, in order. Find the primary source, which took one download here. Check whether the number being quoted is a measurement or a category, because production is measured and reserves are a judgement about economics. Then do the arithmetic yourself, because the ratio everybody repeats turned out to be moving in the opposite direction to the implied narrative.
That is the Protect pillar doing its job. Capital is not usually lost to a bad chart. It is lost to a confident story that nobody checked, sized far too large because the story felt certain.
What this article does not say
It does not say peak gold is nonsense. Flat production across six years, during a period when the metal was in strong demand, is itself evidence that supply does not respond easily to price. That is the serious version of the argument and it stands.
It does not say reserves will keep rising. They have risen for five years. That is a fact about the past, and the revisions behind it depended on conditions that can reverse.
It does not forecast anything about price. Supply is one input among many, and this journal does not publish price levels or predictions.
And it does not tell you to act. It tells you that when somebody quotes a years of supply figure at you, the right response is to ask which edition, which definition, and what the same calculation gave five years ago.
Get the free Black Gold Market blueprint, a short document on protecting capital and on checking a claim against its primary source before you act on it. One email, no spam, unsubscribe anytime.
Get the free blueprint →Frequently asked questions
What is peak gold, in one sentence?
The idea that global gold mine production reaches a permanent maximum and then declines, because the cheapest deposits are mined first and what remains is deeper, lower grade and more expensive to work.
Has the world reached peak gold?
The published figures show a plateau rather than a decline. World mine production was 3,300 tonnes in 2019 and an estimated 3,300 tonnes in 2025, with 3,200, 3,250 and 3,280 tonnes in the years between. Growth has stopped. A permanent fall has not yet shown up in the global total.
How many years of gold are left?
Divide world reserves of 66,000 tonnes by annual production of 3,300 tonnes and you get exactly 20 years. Treat that as a ratio rather than a deadline. The same calculation five years earlier gave about 16.6 years, so the figure lengthened over a period when 16,000 tonnes were mined.
Why do gold reserves keep growing?
Because a reserve is the part of a deposit that is economic to extract under current conditions, not the total metal in the ground. Higher prices, better processing and completed drilling move tonnage into the reserve column. World reserves rose 24.5 per cent between the 2021 and 2026 USGS editions while annual output did not grow.
Which country mines the most gold?
China, at an estimated 380 tonnes in 2025, roughly a tenth of global output. China, Russia, Australia, Canada and the United States together account for 41 per cent of estimated global production, so most of world supply comes from everywhere else.
Does peak gold matter for trading XAU/USD?
Not on a trading timeframe. Mine supply moves by one or two per cent a year, is published annually in arrears and is already in the price. The value of the question is practice at separating a measured number from a category that depends on assumptions.
Where Black Gold Market fits
Black Gold Market is a free journal about reading gold and protecting capital, written for people who would rather check a primary source than be told what to think. Nothing here is sold on a promise of returns and there is no signal service. The free blueprint is a short document on protecting capital and on the unglamorous checks that decide whether a claim holds up. The piece underneath all of it is how to protect your capital when gold gets volatile, and two companions to this one are how much it costs to mine gold per ounce and how supply and demand affect the price of gold.
About the author. Raphael writes Black Gold Market. He has a long standing distrust of round numbers that arrive without a source, which is how a question about running out of gold turned into an afternoon with three government PDFs and a calculator. What matters to him is the level, the context, and the risk, in that order.
This article is educational and is not financial advice. Trading gold and other leveraged products carries a high risk of losing money rapidly, and no entry, stop or target discussed should be treated as a signal. World mine production of 3,300 tonnes in 2019 and 3,200 tonnes estimated for 2020, together with world reserves of 53,000 tonnes and Australian production of 325 tonnes and United States production of 200 tonnes, are from the USGS Mineral Commodity Summaries 2021 gold chapter. World mine production of 3,250 tonnes in 2023 is from the 2025 edition. World mine production of 3,280 tonnes in 2024 and 3,300 tonnes estimated for 2025, world reserves of 66,000 tonnes, Australian reserves of 13,000 tonnes with the Joint Ore Reserves Committee compliant figure of 4,500 tonnes, United States production of 160 tonnes with Nevada at 64 per cent and Alaska at 22 per cent of it, the top 25 operations at 94 per cent, the five largest producers at 41 per cent of global output, and United States resources of 33,000 tonnes split 15,000 identified and 18,000 undiscovered, are from the 2026 edition dated February 2026. All three chapters are linked above and were downloaded and read before publication. The statement that China was the largest producing country in 2025 at around a tenth of global output is from the World Gold Council's global mine production page, also linked. The reserve life figures of 20.0 years and 16.6 years, the zero per cent change in production between 2019 and 2025, the 24.5 per cent rise in reserves, the 20 per cent fall in United States output, the 13.9 per cent fall in Australian output and the 2.9 times ratio between the two Australian reserve definitions are my own arithmetic on those published figures. No gold price is quoted anywhere in this article. Decide your own risk, and never trade money you cannot afford to lose.