

Every few weeks somebody drops a screenshot of the gold COT report into the chat with a line like "commercials are massively short, the top is in". I understand the appeal. It feels like seeing the cards of the players who are supposed to know. I have spent a while with the actual data now, all of it, and the honest summary is that the report is genuinely useful for one thing and is routinely asked to do three other things it cannot do.
Everything below is my own arithmetic on the published record, with the assumptions stated. The position data is the CFTC's, the price data is the London afternoon gold auction, and there are no gold price levels anywhere in this article.
What the gold COT report actually is
The Commitments of Traders report is published by the Commodity Futures Trading Commission. In the CFTC's own words it "is generally published each Friday at 3:30 pm Eastern Time (US), using the data from the immediately preceding Tuesday of that week". It counts open positions in a futures market and sorts them into groups.
Two of those groups do the heavy lifting in most commentary. Commercials are broadly the hedgers, the refiners, miners and dealers with metal or obligations sitting outside the futures market. Noncommercials are broadly the large speculators, the funds. The classification is not a judgement anyone at the CFTC makes about strategy. As the agency puts it, it "is based on the predominant business purpose self-reported by traders on the CFTC Form 40".
The agency is also unusually direct about the limits of its own publication. It states plainly that it "does not analyze the data nor make recommendations on it", and, more pointedly for our purposes, that "CFTC staff does not know specific reasons for traders' positions". That last sentence deserves more attention than it gets, because almost every popular use of the report depends on inferring exactly those reasons.
My sample is every weekly report for COMEX gold from the fifteenth of January 1986 to the twenty second of September 2026. That is 1,935 reports. Net position means long minus short, with spreading excluded from the noncommercial net, which is the CFTC's own convention for this report.
The first thing the gold COT report cannot tell you: that commercials are bearish
This is the most common reading and it is close to meaningless. Across those 1,935 reports the commercials were net short in 1,555 of them, which is 80.4 per cent of the time. They were net long in 380 weeks, so it is not literally always, but "commercials are net short" describes the ordinary state of this market rather than a view about where price is going.
The reason is structural. Somebody who digs metal out of the ground or holds it in a vault sells futures against it. That is what hedging is. Meanwhile the noncommercials were net long in 78.3 per cent of reports. The correlation between the two nets is minus 0.9939, which is about as close to a perfect mirror as anything in financial data gets.
That number is the whole point. The two groups are not two panels of experts voting independently. Every futures contract has a long and a short, so one group's net is very nearly the other group's net with the sign flipped. Announcing that commercials are short while funds are long is, most weeks, announcing that the market exists.
The second thing: that the funds are early
The more sophisticated version of the argument drops the commercials and watches the noncommercial net instead, on the theory that large speculators move first and the rest of us can follow.
So I measured it directly. Across 1,934 week-on-week changes, the correlation between the change in the noncommercial net position and the change in the gold price in the same week is plus 0.5372. That is a strong relationship, and it is exactly what you would expect if funds buy into rising prices and sell into falling ones.
Then the test that matters. The correlation between this week's change in the noncommercial net and next week's price change is plus 0.0238. That is not a small edge. On a sample of nearly two thousand weeks, that is noise.
Read those two numbers together and the picture is unambiguous. Speculative positioning in gold moves with the market, not ahead of it. The report is largely a record of what already happened, which is a perfectly respectable thing for a report to be, and a terrible basis for a forecast.
The third thing: that a crowded long marks the top
This is the belief I most expected to confirm, and the data refused.
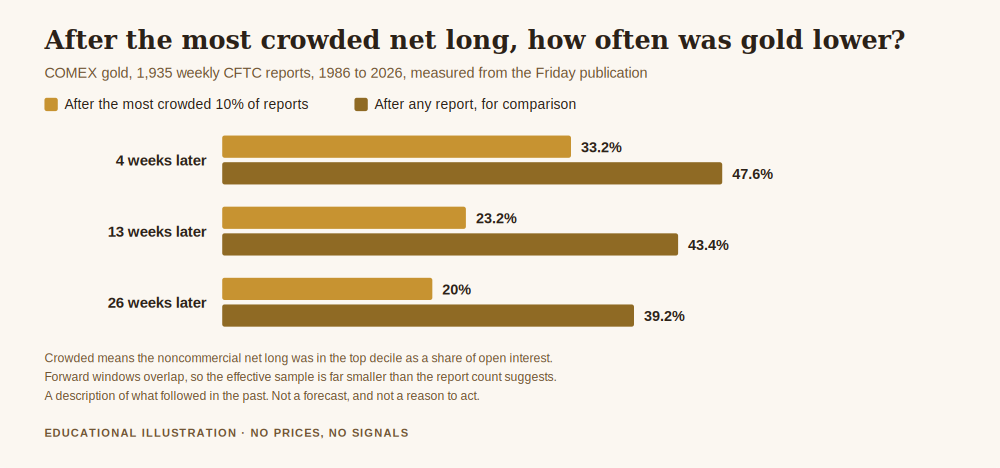
Measured as a share of open interest, the noncommercial net long ran from minus 17.9 per cent at the tenth percentile to plus 45.1 per cent at the ninetieth, with a median of 26.4 per cent. I took the most crowded decile, the weeks when funds were most heavily net long, and measured what gold did afterwards, starting from the Friday publication rather than the Tuesday snapshot, because Friday is the first moment a reader could act on it.
Four weeks later, gold was lower in 33.2 per cent of those crowded cases, against 47.6 per cent after an average report. Thirteen weeks later, 23.2 per cent against 43.4 per cent. Twenty six weeks later, 20.0 per cent against 39.2 per cent. In every window the most crowded readings were followed by fewer declines than normal, not more.
I want to be careful about how far that goes, because it would be easy to flip the folklore over and sell the opposite. Two caveats matter. Gold rose over this sample, which lifts every forward number, and the overlapping forward windows mean the effective sample is far smaller than 175 or 190 independent observations. What the comparison does support is narrow and sufficient: crowded speculative positioning did not mark tops in gold in any reliable way over forty years. If your use of the report rests on that idea, it rests on nothing.
The three day blind spot nobody mentions
There is a practical problem on top of the interpretive ones. The positions are counted at Tuesday's close and published on Friday afternoon. The freshest report anyone can ever read is three days old on arrival.
That gap is not cosmetic. Across the 1,935 weeks, the median absolute move in the gold price between the Tuesday snapshot and the Friday publication was 0.89 per cent, the mean was 1.22 per cent, and the largest was 11.48 per cent. In 46.0 per cent of weeks gold moved at least 1 per cent before the report describing the prior positions became public.
So in nearly half of all weeks, the positions you are reading were assembled in a market that has already meaningfully moved on. If the report were a signal, it would be a signal delivered after the event it was supposedly signalling.
What it is honestly good for
I am not telling you to ignore it. I read it. I just read it as a census rather than a forecast.
It tells you who holds what, which is genuinely useful context. When the noncommercial net is at an extreme you learn something real about the composition of the market: a lot of positions are leaning the same way and those holders are more sensitive to a move against them. That is a statement about the character of a market, and it belongs next to what you already know about how gold ETF flows affect the price of gold and what COMEX gold actually is.
What it does not tell you is direction, timing, or what any of those holders intend to do next. The CFTC says as much itself. Everything that goes wrong with this report goes wrong at the moment somebody turns a description of the past into a prediction of the future, and then sizes a position on it.
If a piece of information cannot survive that question, it should not be allowed to change your risk. That is the same standard I would apply to anything else on the chart, and most things fail it.
Get the free Black Gold Market blueprint, a short document on protecting capital before you try to grow it, including how to decide what a piece of market information is actually worth before you let it change your size. One email, no spam, unsubscribe anytime.
Get the free blueprint →Frequently asked questions
Does the gold COT report predict price?
Not on this evidence. The change in speculative net position correlates with the same week's price change at plus 0.5372 and with the next week's at plus 0.0238, across 1,934 weekly observations. A correlation of 0.02 is indistinguishable from nothing. The report describes what has already been done, and that is a genuinely different thing from a forecast.
If commercials are almost always short, is that signal ever meaningful?
Only in a much narrower way than it is usually used. They were net short in 80.4 per cent of 1,935 reports because hedging against physical metal is their business, and their net is nearly the mirror of the speculative net at minus 0.9939 correlation. What can carry some information is an unusual reading relative to that market's own history, rather than the direction of the net itself. Even then it is context about composition, not a forecast.
Why measure from Friday rather than from the Tuesday the data describes?
Because Tuesday is not available to a reader. The report is published Friday at 3:30 pm Eastern using Tuesday's positions, so measuring forward returns from Tuesday credits you with three days of price movement you could not have acted on. In 46.0 per cent of weeks gold moved at least 1 per cent in that window, so the choice is not a technicality, it changes the answer.
Does a record net long mean a crash is coming?
The record says the opposite of the folklore, though not strongly enough to invert it into a rule. After the most crowded decile of readings, gold was lower four weeks later 33.2 per cent of the time against 47.6 per cent after an average report, and the pattern held at thirteen and twenty six weeks. Gold rose across the sample and the windows overlap, so I would not trade the reverse claim either. The safe conclusion is that crowding did not mark tops.
Which version of the report should I read?
This analysis uses the legacy futures-only report, which is the longest continuous series and goes back to 1986 for gold. The disaggregated and financial-trader versions split the categories more finely and are more informative about who is who, but they start much later, so there is a trade-off between detail and history. For the questions in this article, history mattered more.
So should I stop looking at it?
No. Read it as a census of who is holding what, which is what it is and what the CFTC says it is. The thing to stop doing is converting it into a view, because that conversion is where the money is lost. Nothing in the data supports letting this report change your position size.
Where Black Gold Market fits
Black Gold Market is a free journal about gold, written for people who want to protect capital before they try to grow it. Everything here stays free: the journal, the daily analysis on Telegram, and the Sustainable Trader's Blueprint. There is no profit promise anywhere on this site and there never will be, because nobody can make one honestly. If the writing is useful, the Telegram channel is where the same thinking gets applied to what gold is doing that day, with the level, the context and the risk stated before the outcome is known.
If this article was useful, the two that sit closest to it are how gold ETF flows affect the price of gold and what is COMEX gold. The article this site is really built around is how to protect your capital when gold gets volatile, and it is the right next read.
About the author. Raphael writes Black Gold Market. He spent a couple of years reading positioning data as though it were a forecast before he sat down and measured whether it had ever behaved like one. Nothing in this article is a recommendation to trade, and no entry, stop or target discussed should be treated as a signal.
Sources and method. Position data is the CFTC Commitments of Traders report, legacy futures-only, for COMEX gold, every weekly report from 15 January 1986 to 22 September 2026, 1,935 reports in total, published by the CFTC; the category definitions are described in the CFTC's explanatory notes. Price data is the LBMA Gold Price PM published by the London Bullion Market Association, matched to each report's Tuesday and Friday. Every statistic here is my own arithmetic on those two series. Forward windows overlap, so the effective sample is smaller than the report count suggests, and gold rose over the period, which lifts all forward figures. Past behaviour is not a forecast. Trading carries risk of loss.