

Most traders review their results the way a nervous person reads a thermometer, often, and with far more confidence than the instrument deserves. The question of how to evaluate trading performance is usually answered by opening the account history, looking at the last thirty trades, and deciding on the spot whether the method works. That verdict feels like measurement. It is closer to a coin landing heads a few times in a row.
I want to make the case that a performance review has two separate jobs, and that almost everybody does the second one before the first. Job one is deciding whether you have enough evidence to say anything at all. Job two is saying it. Skip job one and every number you produce afterwards is decoration.
How to Evaluate Trading Performance Without Fooling Yourself First
Start with the uncomfortable arithmetic. Suppose you risk the same amount on every trade, call it one unit of risk, and suppose a win returns that unit and a loss costs it. Suppose further that you have no edge whatsoever, that your true win rate is exactly fifty per cent. How often would a person like that finish a run of thirty trades in front?
The answer is 42.8 per cent of the time. Over ten trades it is 37.7 per cent. Over a hundred it is still 46.0 per cent. Those numbers come from the binomial distribution, and you can reproduce them in a few lines of code. A trader with literally nothing, no edge, no skill, no reason to be in the market, shows a profit after thirty trades in something close to half of all possible lives.
That is the reason a thirty trade sample cannot settle an argument. It is not that thirty is a small number in some vague sense. It is that a zero edge process produces a winning thirty trade record often enough that seeing one tells you very little.
The Error Bar Nobody Draws
The same problem shows up in the statistic traders quote most often, the win rate. If your true win rate is fifty per cent, the win rate you actually observe across a sample wobbles around that figure, and the wobble is large.
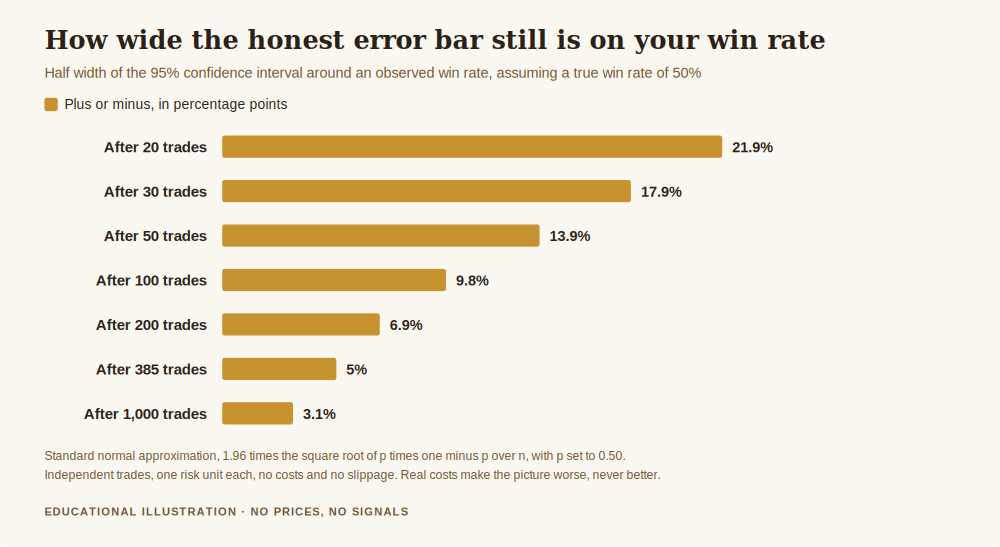
After twenty trades the ninety five per cent confidence interval around an observed win rate is plus or minus 21.9 percentage points. In plain words, a trader whose true win rate is fifty per cent could easily observe anything from 28 per cent to 72 per cent and none of it would be surprising. After fifty trades the band is still plus or minus 13.9 points. After two hundred it is plus or minus 6.9 points.
To get the band down to plus or minus five percentage points you need 385 trades. That figure is not a matter of opinion. It falls straight out of the standard normal approximation, 1.96 multiplied by the square root of p times one minus p over n, with p set to the hardest case of 0.50. The assumptions are that trades are independent, that each risks the same unit, and that costs are ignored. Real costs and real slippage make the picture worse, never better.
So when somebody tells you their strategy has a 65 per cent win rate over forty trades, the honest reading is that their true win rate is somewhere between about 49 and 81 per cent. That range contains "no edge at all" and it contains "genuinely excellent". Forty trades cannot separate them.
Losing Runs Are Not Evidence of Anything
The same statistics work in the other direction, and this is the half that costs people their accounts. Take the same zero edge coin flipper, give them two hundred trades, and ask how likely they are to hit a losing streak somewhere in there.
A run of five consecutive losses appears in 96.6 per cent of such sequences. Six in a row appears in 80.1 per cent. Seven in a row in 54.4 per cent. Eight in a row in 32.0 per cent. These are exact figures from a small dynamic programming calculation over the same fifty fifty assumption, not a simulation with a random seed.
Read that again, because it reframes an experience almost every trader has had. Six losing trades in a row is not a signal that something has broken. In a two hundred trade year it is the single most likely thing to happen to you. A trader who tears up a working method after a run of six has responded to noise. A trader who doubles their size to win it back has responded to noise with leverage.
This is the part of the job I think of as Protect before Master. You do not need to know whether your method is good in order to know that a normal losing run is coming. You only need to survive the arrival.
What the Professionals Do About This Exact Problem
It is worth knowing that this is not a retail problem that clever people have solved. It is the central problem in performance evaluation everywhere, and it is genuinely hard.
Eugene Fama and Kenneth French took it up directly in Luck versus Skill in the Cross-Section of Mutual Fund Returns, published in The Journal of Finance in 2010, volume 65, pages 1915 to 1947, DOI 10.1111/j.1540-6261.2010.01598.x. They were looking at professional US equity fund managers with far longer records than any retail trader has, and they used bootstrap simulations to ask how much of the observed spread in results could be produced by luck alone.
Their conclusion, in their own words, is that the aggregate portfolio of actively managed funds is close to the market portfolio and that "the high costs of active management show up intact as lower returns to investors", with bootstrap simulations suggesting "few funds produce benchmark-adjusted expected returns sufficient to cover their costs". Evidence of genuine skill, they found, turns up only in the extreme tails, and only once costs are added back.
Two things follow for us. First, if a decade of monthly returns from a professional fund is a marginal sample, forty trades from a retail account is not a sample at all. Second, costs are not a detail you tidy up later. They were the main event in that study, and they are the main event in ours.
The Metrics That Survive a Small Sample
None of this means a review is pointless until trade 385. It means you should review the things that are stable in small samples, and hold the things that are not.
Stable in small samples, because they measure your behaviour rather than the market's verdict:
- Rule compliance. Out of your last thirty trades, how many followed your own written rules? This is a count, not an estimate. Thirty observations tell you thirty things.
- Risk consistency. Did every trade actually risk the unit you said it would? Variance in your own position sizing is the fastest way to make a good method produce bad results, and it shows up immediately.
- Cost per round turn. Spread, commission and slippage are close to deterministic. Twenty trades is plenty to know what you are paying.
- Process errors. Trades taken outside your session, entries you moved, stops you widened. Each one is a fact, not a sample.
Unstable in small samples, and therefore to be recorded but not judged:
- Win rate, for all the reasons above.
- Expectancy, which is built from win rate and average sizes and inherits every bit of their uncertainty. If you want the mechanics of that number, we wrote it up separately in what is expectancy in trading.
- Maximum drawdown, which is close to the most sample dependent statistic in the whole business.
- Any comparison between two strategies, which needs enough evidence for both.
The practical form of this is a review that has two columns and refuses to mix them. One column is what you did, reviewed monthly. The other is what the market paid, reviewed on a trade count rather than a calendar, and read with the error bar attached.
The Context Every Retail Review Sits Inside
There is one external number worth keeping beside all of this. When the European Securities and Markets Authority introduced its restrictions on contracts for difference for retail clients, it published the evidence base behind the decision, including national regulator findings that between 74 and 89 per cent of retail accounts lose money on these products, with average losses per client running from around 1,600 to 29,000 euro. You can read the ESMA announcement in full.
That is not a forecast about you. It is a base rate, and base rates matter most when your own sample is small. If you have forty trades of evidence and the population you are drawing from loses money three times out of four, the honest posture is that your forty trades have not yet moved you away from the base rate. They will need to be a lot more numerous before they do.
Get the free Black Gold Market blueprint, a short document on protecting capital before you try to grow it, including the review structure described in this article. One email, no spam, unsubscribe anytime.
Get the free blueprint →Frequently Asked Questions
How many trades before I can judge my strategy?
For a win rate estimate accurate to within five percentage points, 385 trades under the assumptions above. That is a demanding standard and most people will not reach it quickly, which is exactly the point. Long before then you can judge your rule compliance, your risk consistency and your costs, and those are the things you can actually change.
My last thirty trades were profitable. Does that mean nothing?
It means something, just far less than it feels like. A trader with no edge at all finishes thirty trades in profit 42.8 per cent of the time. A profitable run is weak evidence in favour, not proof. Keep trading the method, keep the record, and let the sample grow.
I have had six losses in a row. Should I stop?
Six consecutive losses appear in about 80 per cent of two hundred trade sequences even with a fifty per cent win rate, so the streak on its own is not information. Stop if you have broken your own rules, if your risk per trade has drifted, or if the drawdown has reached a limit you set in advance. Do not stop merely because the last six were red.
Is a higher win rate better?
Not on its own, and chasing it is a common way to damage a method. A high win rate paired with small wins and large losses can lose money steadily. Measure results in risk units, which is what what is R multiple in trading is about, so wins and losses are comparable.
Where did the numbers in this article come from?
The confidence intervals are the standard normal approximation with the true win rate set to 0.50. The probabilities of finishing in profit are exact binomial tail sums. The losing streak probabilities come from an exact dynamic programming calculation over the same assumption. All of them assume independent trades, equal risk per trade and no costs, and all three assumptions are stated so you can disagree with them. The ESMA figures and the Fama and French paper are linked and cited directly.
Where Black Gold Market Fits
Black Gold Market is free to follow. Daily XAU/USD analysis with the level, the context and the risk stated before the outcome is known, losing days included. There is a free blueprint for anyone who wants the capital protection material in one place, and an optional Kit for people who want the whole method. Nothing here promises a profit, and nothing here is a signal service. If you want the groundwork first, start with how to protect your capital when gold gets volatile, or with how to reduce drawdown in trading.
Evaluate the process monthly, evaluate the edge on trade count, and keep the error bar attached to every number you quote back to yourself.
About the author. Raphael writes Black Gold Market. He spends more time on measurement than on entries, mostly because he has watched good methods get abandoned on the strength of thirty trades and bad ones get trusted on the strength of thirty more. Nothing in this article is a recommendation to trade, and no entry, stop or target discussed should be treated as a signal.