

You have heard the chain of reasoning. Oil goes up, so costs go up, so inflation goes up, so gold goes up, because gold is the inflation hedge. It is tidy, it gets repeated on television, and people size positions on it. So I went and measured the gold and oil correlation properly, over every month for which both prices exist, and the answer is not the one the story predicts. It is close to nothing, and it does not even stay close to nothing reliably.
The data is the World Bank's Commodity Price Data, the series most people call the Pink Sheet, in the update published on 2 October 2026. It carries monthly gold and monthly crude oil prices in the same file, which matters more than it sounds: one source, one set of dates, no risk of quietly comparing a London fix against a different day's barrel. That gives 801 months where both exist, running from January 1960 to September 2026.
Everything numerical below is my own calculation, with the assumptions written out as I go. There are no gold prices in this article, nothing here is a forecast, and no part of it tells you what to do with a position.
How I measured the gold and oil correlation
Four choices decide this calculation, and all four are worth stating because changing any of them changes the number.
First, I measure monthly log returns rather than price levels. Correlating price levels is the classic way to manufacture a relationship that is not there: both gold and oil have drifted upward across sixty years, so their levels move together simply because time passes. Returns strip that out and ask the real question, which is whether they move together month to month.
Second, the sample starts in January 1974, not 1960. Before the 1970s, crude was sold at administered prices rather than market prices, so correlating it with anything measures an administrative decision rather than a market. That leaves 632 months of genuine market data.
Third, correlation here is the ordinary Pearson correlation on those monthly returns. Fourth, when I count months that moved together, I mean months where both returns carried the same sign, discarding the handful where one was exactly flat.
The number, and it is smaller than the story needs
Across those 632 months, the correlation between gold's monthly return and crude oil's monthly return is plus 0.117.
That is positive, so there is something there. It is also very small. Square it and you get the share of gold's monthly variation that moves in step with oil: 1.4 per cent. The other 98.6 per cent comes from somewhere else. If you knew exactly what oil did this month and nothing else, you would have learned almost nothing about what gold did.
It gets more awkward for the story when you look at the recent decades on their own. Starting the sample in 1990 gives plus 0.117. From 2000, plus 0.101. From 2010, plus 0.005, which is indistinguishable from no relationship at all. From 2016, the correlation is minus 0.051, faintly negative. The link the story asserts has been fading for most traders' entire careers.
There is a simpler way to feel the same result. Of those 632 months, discarding flat ones leaves 554 where both moved. Gold and oil moved in the same direction in 312 of them, which is 56.3 per cent. A fair coin would have given you 50 per cent. The entire predictive content of the famous relationship, stated as plainly as I can, is about six percentage points better than a coin.
And it does not even hold still
A weak average could still hide a strong relationship that comes and goes, so the next question is whether the correlation is at least stable. It is not.
I took every rolling 36 month window in the sample, 597 of them, and calculated the correlation inside each one. The lowest was minus 0.324, in the window ending November 1978. The highest was plus 0.552, ending August 1990. The median was plus 0.122, close to the full sample figure.
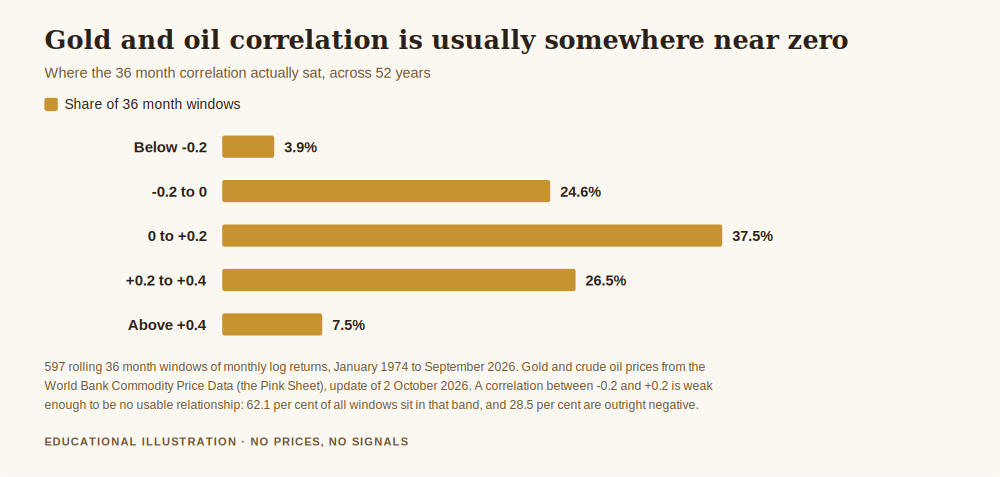
Read the distribution rather than the average. In 28.5 per cent of three year windows the correlation was negative, meaning gold and oil were leaning against each other, not together. In 62.1 per cent of windows it sat between minus 0.2 and plus 0.2, which is the band where there is no usable relationship in either direction. Only 3.7 per cent of windows exceeded plus 0.5.
So a trader who learned the oil and gold rule during the window ending in 1990 would have spent the following decades being wrong about a quarter of the time and directionless most of the rest. That is the real hazard in this kind of folklore. It is not that it is never true. It is that it is true often enough to be remembered and rare enough to be useless.
What happens in the months oil really moves
If the relationship lives anywhere, it should live in the dramatic months, so I isolated them. There are 100 months in the sample where crude moved at least 10 per cent.
In the 49 months where oil rose at least 10 per cent, gold also rose in 30 of them, which is 61.2 per cent, and gold's average move across those months was plus 1.55 per cent. That is the story's best evidence, and it is genuinely something: a mild tilt upward when oil surges.
Now the other side. In the 51 months where oil fell at least 10 per cent, gold fell in only 26 of them, which is 51.0 per cent, a coin flip, and gold's average move was minus 0.58 per cent. Push the threshold to 20 per cent and it inverts entirely: in the 16 months where oil collapsed by a fifth or more, gold fell in only 6 of them, and its average move was positive, plus 0.26 per cent.
That asymmetry is the most interesting thing in this article. The relationship is not symmetric, because the two directions are different events. An oil spike is often a supply shock or a geopolitical scare, and the same fear that bids oil bids gold. An oil collapse is often demand weakness, which is a recession signal, and recession fears cut interest rates, which tends to help gold. Gold is not following oil in either case. It is responding to the thing that moved oil, and sometimes that thing points the same way and sometimes it does not.
They are not even the same size of animal
One more measurement, because it matters for anyone who holds both. Annualised from monthly returns, gold's standard deviation over the sample is 15.9 per cent and crude oil's is 30.3 per cent. Oil is 1.91 times as volatile as gold. In typical months the gap is similar: the median absolute monthly move is 2.24 per cent for gold and 4.30 per cent for oil.
So even in the minority of windows where the two do move together, they do not move together in equal measure. Treating an oil move as a proxy for a gold move of comparable size is a sizing error on top of a direction error.
Why the story survives anyway
A thing that is 1.4 per cent true does not usually survive fifty years of repetition, so it is worth asking why this one has.
Partly because the mechanism is real but indirect. Oil does feed into inflation, inflation does influence interest rate expectations, and rate expectations genuinely do matter for gold, because gold pays no yield and competes with the real return on cash. That is a real chain. It is just long, and at every link something else can dominate, which is how a true mechanism produces a correlation of 0.117.
Partly because the exceptions are memorable. The windows where correlation hit plus 0.5 were dramatic periods that everyone can name, and nobody builds a memory out of the 37.5 per cent of windows where the correlation sat between zero and plus 0.2 and nothing notable happened.
And partly because the story is useful to people selling a narrative. A market commentary that says oil is up so gold should follow sounds like analysis. Saying that the relationship explains 1.4 per cent of the variation sounds like nothing, which is precisely what it is worth.
What this article is not saying
It is not saying oil is irrelevant to gold. A correlation of 0.117 over 632 months is a real relationship, just a weak one, and in some three year windows it has been meaningfully positive.
It is not saying I have measured the mechanism. Correlation does not separate cause from shared cause, and my reading of the asymmetry, that both metals respond to a third thing, is an interpretation rather than something the arithmetic proves.
Monthly data also cannot see shorter horizons. It is entirely possible that oil and gold move together over hours around a specific headline in a way that averages away by the end of the month. I have not measured that, and I would not trust anyone quoting you a number for it without showing their window and their sample.
If you want the groundwork underneath this piece, start with how to protect your capital when gold gets volatile, then the gold and silver correlation, which is a far stronger relationship than this one, and gold against real yields, which is where the actual transmission lives. The underlying prices came from the World Bank's commodity markets data, which anyone can download and check.
What I would actually do with this
Three things follow, and not one of them is a trade.
First, stop using an oil move as a reason for a gold position. Six percentage points better than a coin is not a reason. If you want to hold a view on gold, hold it for a reason that explains more than 1.4 per cent of the variation.
Second, when you catch yourself repeating a market relationship you have never measured, treat that as a flag rather than as knowledge. I believed this one for years. It took an afternoon with a spreadsheet to find out it was mostly decoration, and the same afternoon is available to anyone for free.
Third, if you hold both gold and oil exposure and you assumed they would offset each other, check that assumption. Across a quarter of three year windows they lean against each other and across most windows they barely relate, which means a position built on their relationship is really two separate positions wearing one name.
Get the free Black Gold Market blueprint, a short document on protecting capital before you try to grow it, including how to tell a market relationship you can use from one you have only been told about. One email, no spam, unsubscribe anytime.
Get the free blueprint →Frequently asked questions
What is the gold and oil correlation, in one number?
Measured on monthly returns from January 1974 to September 2026, it is plus 0.117. That is weakly positive, and it means oil moves in step with about 1.4 per cent of gold's monthly variation. The other 98.6 per cent comes from elsewhere.
Does gold go up when oil goes up?
More often than a coin, but not much more. Across the sample the two moved in the same direction in 56.3 per cent of months. In the stronger months where oil rose at least 10 per cent, gold rose in 61.2 per cent of them, so the tilt is real and small.
Why do people say oil drives gold then?
Because the mechanism exists but is long and indirect: oil feeds inflation, inflation moves rate expectations, and rate expectations matter for an asset that pays no yield. Every link in that chain can be overwhelmed by something else, which is how a true mechanism ends up with a correlation of 0.117.
Has the relationship changed over time?
Yes, and it has weakened. From 1990 the correlation is plus 0.117, from 2000 plus 0.101, from 2010 plus 0.005, and from 2016 minus 0.051. Across rolling three year windows it has ranged from minus 0.324 to plus 0.552.
If oil crashes, should I expect gold to crash?
The data says the opposite of what most people assume. In the 16 months where oil fell by at least 20 per cent, gold fell in only 6 of them, and gold's average move across those months was slightly positive. A demand driven oil collapse often comes with rate cut expectations, which is a different force entirely.
Which correlation is actually worth knowing?
Gold against real yields is the relationship with a direct mechanism behind it, and gold against silver is far stronger than gold against oil. Both are covered in the journal, and neither is strong enough to be treated as a rule.
Where Black Gold Market fits
Black Gold Market is a free journal about reading gold and protecting capital, written for traders who would rather understand a mechanism than be handed a conclusion. Everything on the site is free to read and there is nothing to buy to follow along. The optional piece is the Sustainable Trader's Blueprint above, a short document on protecting capital before trying to grow it. We do not promise profits, we do not publish results, and we do not think anyone can tell you what your account will do. The piece this one sits underneath is how to protect your capital when gold gets volatile.
About the author. Raphael writes Black Gold Market. He repeated the oil and gold rule for years before he ever measured it, which is a cheap habit to break and an expensive one to keep, and he now checks a relationship before he leans on it. He prefers the level, the context and the risk to any story. Nothing in this article is a recommendation to trade, and no entry, stop or target discussed should be treated as a signal.