

Gold vs real yields is the one macro story almost everyone in this market can recite. Real yields fall, gold rises. Real yields rise, gold falls. It gets repeated on every chart channel and in most morning notes, usually with the confidence of a law of physics, and usually without a single number attached to it.
I decided to attach the numbers. I took 128 months of the published ten year real yield and the published gold benchmark, from January 2016 to the middle of August 2026, and measured how tightly the two actually move together. The relationship is real. It is also a great deal weaker than the way people talk about it, and the gap between those two facts is where accounts get damaged.
What a Real Yield Actually Is
A nominal bond yield is what the bond pays. A real yield is what it pays after inflation is taken out, and the United States Treasury publishes it directly, because inflation protected securities are quoted in real terms rather than estimated from a model.
On 13 August 2026 the Federal Reserve's own H.15 release put the ten year nominal Treasury yield at 4.63 percent and the ten year inflation indexed yield at 2.39 percent. The gap between them, 2.24 percentage points, is roughly what the bond market was pricing for inflation over the next decade. The Treasury's separate real yield curve gives 2.41 percent for 14 August. Two independent official publications, and they agree.
The reason this number is supposed to matter for gold is opportunity cost. Gold pays no coupon. When a government bond pays you 2.4 percent a year above inflation, holding a metal that pays nothing has a visible price. When the real yield is below zero, as it was for a long stretch of this sample, the bond is guaranteed to lose you purchasing power and the metal that pays nothing suddenly looks less expensive to hold. Over this period the ten year real yield ran from as low as minus 1.16 percent to as high as 2.47 percent, so the sample covers both worlds.
That is the theory. It is a good theory. Now the measurement.
Gold vs Real Yields, Measured Over 128 Months
I took the last published business day of each month for both series, from January 2016 through 14 August 2026. That gives 128 observations and 127 monthly changes. For the real yield I measured the change in percentage points. For gold I measured the percentage change in the published afternoon benchmark. I correlated the changes, not the levels, because two series that both trend will correlate for reasons that have nothing to do with each other.
The correlation came out at minus 0.43.
That is a genuine relationship and it points the way the theory says it should. It is also worth being precise about what a correlation of minus 0.43 means, because this is where the story gets oversold. Squared, it is 0.186. Moves in the real yield account for about 19 percent of the variation in monthly gold moves. The other 81 percent is something else: central bank buying, currency moves, positioning, fear, and a large amount of nothing in particular.
So the honest sentence is not "gold moves because real yields move". It is "about a fifth of gold's monthly variation lines up with real yields, and four fifths does not".
The Two Buckets
Correlation is an abstraction. The same data split into two piles is easier to act on.
In the 66 months where the real yield fell, gold rose in 55 of them. That is 83 percent, and the average monthly move was plus 3.30 percent, median plus 3.47 percent.
In the 59 months where the real yield rose, gold rose in only 16. That is 27 percent, and the average was minus 1.17 percent, median minus 1.21 percent. Two months were unchanged.
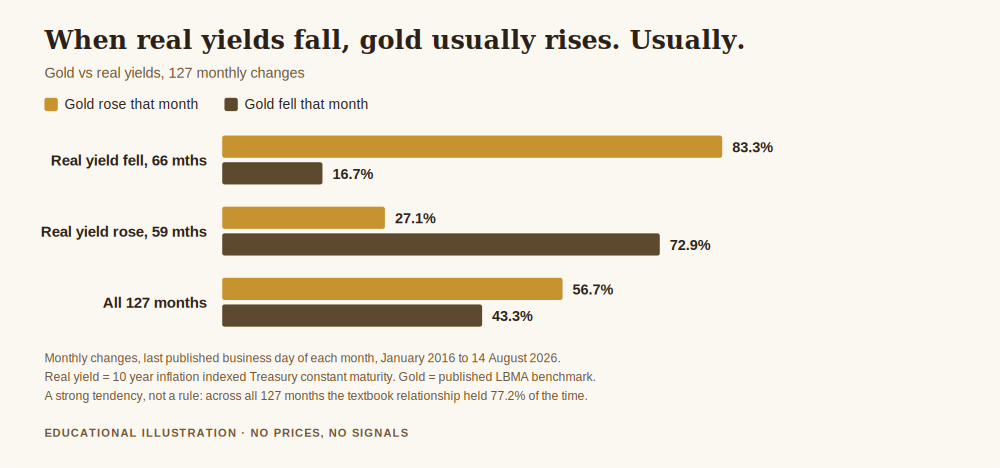
That is a strong asymmetry and I do not want to talk you out of it. If someone tells you gold tends to do better when real yields are falling, the data agrees with them.
What the data does not agree with is treating it as a rule. Combine both buckets and the textbook relationship held in 98 of 127 months, which is 77.2 percent. It failed in 29 months, which is 22.8 percent. Roughly one month in four, gold and real yields moved in a way that would have made a confident macro trader look foolish, and a leveraged one look worse.
One Month in Four, and Why That Number Matters More Than the Correlation
Consider what a 22.8 percent failure rate does to a position held with conviction.
If you enter a trade because real yields are falling and therefore gold "must" go up, you are, on this evidence, taking a position that is directionally right about three times out of four in monthly terms. That is a decent base rate. It is nowhere near certainty, and the trouble is that conviction does not scale down when the base rate does. People do not size a 77 percent idea at 77 percent of their normal risk. They size it larger, because the story feels complete, and the story feeling complete is precisely the feeling that precedes the fourth month.
The clearest example in this sample is January 2026. Gold had its largest single month rise of the entire period, plus 14.06 percent. The ten year real yield that month moved by 0.03 percentage points. Essentially nothing. The biggest month in the sample was explained by the story almost not at all.
The reverse happened in March 2026, gold's worst month at minus 11.76 percent, alongside a real yield rise of 0.28 percentage points. That one fits the story in direction, but a quarter of a percentage point of real yield is not a plausible explanation for an eleven percent fall in anything. The story was available afterwards, which is different from the story being the cause.
The Relationship Does Not Sit Still
The last thing I measured is the one I would most want to know before leaning on this in a live position. I calculated the correlation in rolling 24 month windows, 104 of them, to see whether minus 0.43 is a stable property or an average of very different regimes.
It is an average of very different regimes. The strongest window reached minus 0.78, ending in April 2018, which is close to the relationship the textbooks describe. The weakest reached 0.00, ending in September 2025, meaning that for two full years gold and real yields were, for practical purposes, unrelated. The most recent window, to August 2026, sits at minus 0.39.
Only one window out of 104 was positive, so the relationship almost never inverts outright. But it does switch off. Somebody who built a framework on gold vs real yields during the strong period and carried it unchanged into the weak period was using a tool that had quietly stopped working, and nothing on the chart would have announced it.
Get the free Black Gold Market blueprint, a short document for deciding in advance how much a market story is allowed to change your position size. One email, no spam, unsubscribe anytime.
Get the free blueprint →Frequently Asked Questions
Does gold always rise when real yields fall?
No. Over 127 monthly changes from 2016 to 2026, gold rose in 83 percent of the months when the ten year real yield fell. That is a strong tendency and it is not a guarantee, and the 17 percent is not rare enough to plan around ignoring.
What correlation should I expect between gold vs real yields?
Minus 0.43 on monthly changes over this sample, which means about 19 percent of the variation is shared. In rolling two year windows it ranged from minus 0.78 to 0.00, so any single number will misrepresent some period.
Where do I find the real yield myself?
The Federal Reserve publishes inflation indexed Treasury constant maturities in its weekly H.15 release, and the Treasury publishes a daily real yield curve. Both are free. The gold series in this article is the published LBMA benchmark. Everything above can be rebuilt from those two sources.
Is a falling real yield a reason to buy gold?
It is a reason to understand the environment you are trading in, which is not the same thing. This article makes no recommendation to hold any position. A base rate around three months in four is context for a decision, not a decision, and it says nothing at all about where a level sits or when to act.
Why measure changes rather than levels?
Because both series trend over long periods, and two trending series produce impressive correlations that mean nothing. Changes ask the harder and more useful question: when this moved, did that move.
Does this hold for shorter timeframes?
I have not measured it below monthly, so I am not going to claim it does. What I would expect, and expectation is all it is, is that the relationship gets weaker as the timeframe shortens, because more of a single day's move is flow and noise rather than macro repricing.
Where This Leaves You
I am not asking you to throw the framework away. Gold vs real yields is one of the few macro relationships in this market with a measurable base rate behind it, and 83 percent in one bucket against 27 percent in the other is worth knowing.
I am asking you to hold it at its real strength. About a fifth of the variation. Right roughly three months in four. Occasionally switched off for two years at a stretch. That is a useful piece of context and a terrible reason to increase size, and the difference between treating it as the first thing and treating it as the second is most of what separates an account that survives a wrong quarter from one that does not.
The habit that protects you here is the boring one: decide your risk before the story, not after it. The framework for that is how to protect your capital when gold gets volatile. If you want the neighbouring pieces of the macro picture, how interest rates affect the price of gold covers the nominal half of this equation and how inflation affects the price of gold covers the other half, since a real yield is simply the two of them subtracted from each other.
About the author. Raphael writes Black Gold Market. He works on the part of this business that happens before the trade, the level, the context, and the risk, and on the conviction that a method you can follow through a quiet quarter is worth more than a better one you cannot.
Disclaimer: This article is general educational content about the statistical relationship between a published bond yield series and a published gold benchmark. It is not financial advice, not a recommendation to buy or sell gold, bonds or any other instrument, and not a suggestion to open any particular position. Trading gold, CFDs and leveraged products carries a high risk of losing money rapidly. No entry, stop or target discussed should be treated as a signal. Every correlation, average and frequency above was computed by me from two public sources, the ten year inflation indexed Treasury constant maturity published by the United States Treasury and cross checked against the Federal Reserve H.15 release, and the published LBMA gold benchmark, using the last published business day of each month from January 2016 to 14 August 2026, 128 observations and 127 monthly changes. Those figures describe how two public series behaved in the past. They are not a forecast, and a base rate measured over one decade is not a promise about the next month. No gold price is quoted anywhere in this article and no trading results are represented.