

Every few weeks somebody in the Black Gold Market group posts a screenshot of two charts side by side and asks the same thing: why is silver up and gold down today, when everybody says they are the same trade? The question usually arrives with a note of suspicion, as though one of the two markets must be lying.
Neither is. The two metals spend most of their time drifting in the same direction, which is exactly why the days they separate feel like a malfunction. They are not one asset with two tickers. They are two different demand structures that happen to overlap, and once you have seen where each one's demand actually sits, the days they disagree stop being mysterious and start being informative.
This is a Protect question before it is a chart question, because a trader who believes gold and silver are interchangeable will size two positions as though they were one. Here is the structure, with the published figures, and no price anywhere in this article.
Why Is Silver Up and Gold Down, the Short Answer
They answer to different buyers.
Roughly half of the silver in the world gets consumed by factories. Roughly one twentieth of the gold does. Gold's demand is dominated by people and institutions who want to hold it, silver's is split almost down the middle between people who want to hold it and industries that want to use it up. When something happens that is good for holding and bad for making, gold rises and silver does not. Reverse it and silver rises while gold does not.
That is the whole mechanism. The rest of this article is the evidence for it and the arithmetic that follows from it, because a claim like that is worth nothing without the numbers underneath.
Where Gold's Demand Actually Sits
The United States Geological Survey publishes an annual accounting of who consumes each metal, and it is about as disinterested a source as exists. Nobody at the USGS is talking a position. Its Mineral Commodity Summary for gold, published January 2025, breaks estimated global gold consumption, excluding exchange traded funds and similar vehicles, into six pieces.
Jewellery takes 45 percent. Central banks and other institutions take 21 percent. Physical bars take 19 percent. Official coins, medals and imitation coins take 7 percent. Electrical and electronics takes 6 percent. Everything else is 1 percent.
Read that list again with one question in mind: how much of this gold gets destroyed? Almost none of it. Jewellery is worn and eventually sold back. Bars sit in vaults. Central bank holdings sit in vaults for decades. Coins are kept. Only the 6 percent going into electronics is genuinely consumed, and even a good part of that comes back through recycling. The USGS puts recycled gold at about 45 percent of reported United States consumption in 2024.
So gold's demand is overwhelmingly a demand to hold. That has a consequence most people skip past: gold's price is set far less by how much is mined this year than by whether the people already holding it want to keep holding it, and whether new holders want in. The mine supply is a trickle next to the above ground stock.
Where Silver's Demand Sits, and Why It Is Not the Same Metal
Now the same exercise for silver. The USGS Mineral Commodity Summary for silver gives estimated domestic uses in the United States for 2024, and the shape is completely different.
Physical investment in bars takes 30 percent. Electrical and electronics takes 29 percent. Coins and medals take 12 percent. Photovoltaics, meaning solar cells, take another 12 percent. Jewellery and silverware take 6 percent. Brazing and solder take 4 percent. Other industrial uses and photography take 7 percent.
Add the industrial lines together, electronics, solar, brazing and the other industrial uses, and you get 52 percent. Add the investment lines, bars and coins, and you get 42 percent. Jewellery, which was gold's largest single block at 45 percent, is 6 percent here.
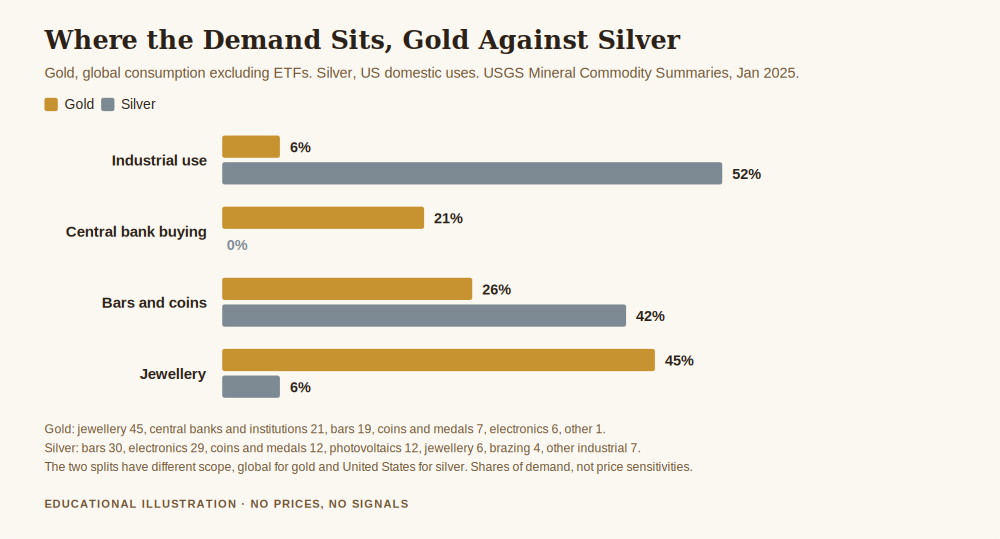
Two honest caveats before anyone builds anything on that chart. The gold split is global consumption and the silver split is United States domestic use, because that is how the USGS reports each one, so the scopes are not identical. And a share of demand is not a price sensitivity. Knowing that 52 percent of silver goes to factories does not tell you what happens to the price when factory orders fall by a tenth. It tells you where to look, not how far the number moves.
With that said, the difference between 6 and 52 is not a rounding argument. On the industrial line, silver's exposure is 8.67 times gold's.
One Shock, Two Different Answers
Here is the arithmetic, and I want to be exact about what it is and is not. This is a weighting exercise on published demand shares, not a model of price. The assumption, stated plainly: imagine one event that pulls industrial demand down by a tenth and pushes investment and monetary demand up by a tenth, leaving jewellery alone. A growth scare with a nervous edge to it would look roughly like that.
Run it against gold's weights. Industrial is 6 percent of the base, so a tenth off it costs 0.6 points. The holding block, central banks plus bars plus coins, is 47 percent, so a tenth added to it gains 4.7 points. Gold's demand base ends up 4.1 points higher.
Run the identical event against silver's weights. Industrial is 52 percent, so a tenth off it costs 5.2 points. The investment block is 42 percent, so a tenth on it gains 4.2 points. Silver's demand base ends up 1.0 point lower.
Same event. Gold up, silver down, a gap of 5.1 points, and not one word of it required a chart pattern, a sentiment reading or a theory about manipulation. It fell out of the weights.
Turn the event around, a strong manufacturing cycle with calm markets, and the arithmetic flips sign exactly: gold's base falls 4.1 points and silver's rises 1.0. That is the day the group posts screenshots.
One more way to see how lopsided this is. Ask how large an industrial slump each metal would need in order to cancel out that same 10 percent lift in investment demand. Gold would need industrial demand to fall by 78.3 percent, which is not a scenario, it is a civilisational event. Silver would need only 8.1 percent. Silver is 9.70 times easier to drag the other way.
The Buyer Silver Does Not Have
Look back at the two lists and find the line with no counterpart. Central banks and other institutions are 21 percent of gold demand. On the silver list, there is no such line at all. Zero.
That single absence matters more than its size suggests, because of what kind of buyer a central bank is. It does not buy gold because it expects a good quarter. It buys as a reserve decision, on a horizon measured in decades, and it does not sell because the chart looks tired. It is the least price sensitive, least reactive demand in the entire market, and it sits underneath gold and not underneath silver.
Silver's equivalent block, the 42 percent in bars and coins, is retail and institutional investment demand, and that behaves nothing like a reserve manager. It arrives in enthusiasm and leaves in boredom. So silver has a comparable weight of investment demand on paper and a far less patient version of it in practice.
The supply side compounds this, and the USGS is blunt about it. Silver, it notes, is primarily obtained as a byproduct from lead, zinc, copper and gold mines, and polymetallic deposits account for more than two thirds of United States and world silver resources. Think about what that means. The decision to run most of the mines that produce silver is not a decision about silver. It is a decision about copper, or about zinc. Silver supply arrives largely as a consequence of other people's business cases.
Gold does not work that way. About 7 percent of United States gold came out as a byproduct of base metal ores in 2024, and the rest came from mines that exist to produce gold. Add the scale gap, world mine production in 2024 was an estimated 25,000 tons of silver against 3,300 tons of gold, 7.58 times more silver by weight, and you have two markets with different buyers on one side and different producers on the other.
Get the free Black Gold Market blueprint, a short document on protecting capital before the trade rather than after it, including how to count what your open positions actually add up to. One email, no spam, unsubscribe anytime.
Get the free blueprint →What This Changes About How You Hold Them
The practical consequence is about size, not about direction, and it runs in both directions at once.
If you hold gold and silver at the same time believing you have spread your risk, the demand structures say you have not spread it as far as you think on the days they agree, and you have taken two genuinely different bets on the days they do not. Both of those are fine as long as you counted them. Neither is fine if you sized as though the second position were a hedge for the first.
And when you see the two separate, the useful reflex is not to decide which market is wrong. It is to ask which block of demand just changed, because the answer is usually visible in ordinary economic news rather than on the chart. Silver leading gold higher tends to look like an industrial story. Gold leading while silver lags tends to look like a monetary or a fear story. The metals are not disagreeing with each other. They are answering different questions, and today somebody asked the question that only one of them cares about.
None of that is a trade. It is context, which is the thing that decides whether a level means anything when you get to it.
Frequently Asked Questions
Why is silver up and gold down on a given day?
Because industrial use is about 52 percent of silver's demand and about 6 percent of gold's, per the USGS January 2025 summaries. News that is good for manufacturing and neutral for safe haven demand pushes on the block that dominates silver and barely touches the block that dominates gold. The reverse produces the reverse.
Does this mean silver is riskier than gold?
It means silver's demand is more exposed to the economic cycle, which historically shows up as larger swings in both directions. Whether that is riskier for you depends entirely on your position size, not on the metal. A large gold position is more dangerous than a small silver one.
Do central banks buy silver?
Not in any way that shows up in the demand accounting. The USGS lists central banks and other institutions at 21 percent of global gold consumption; there is no equivalent line in the silver breakdown. That patient, price insensitive block of demand sits under gold and not under silver.
If they diverge, does one of them eventually catch up?
That is an assumption, not a finding, and this article does not support it. Nothing in the demand structure requires the two to reconverge on any timetable. Trading a divergence on the belief that it must close is a bet on mean reversion, which is a separate thesis that needs its own evidence.
Can I use gold and silver together to diversify?
Partially, and less than most people assume. They share a large investment demand block, which is why they usually move together, and the days they separate are driven by the industrial block that only one of them has. Treat the pair as two positions that are correlated most of the time, and count them that way when you size.
Where did the numbers in this article come from?
All demand shares, the recycling figures, the byproduct description and the 2024 world mine production totals are published by the United States Geological Survey in its Mineral Commodity Summaries of January 2025, linked above. The 8.67 times, 7.58 times, 9.70 times figures and the entire shock arithmetic are my own calculations on those published shares, using the assumptions stated in the text. No price for either metal appears anywhere in this article.
Where Black Gold Market Fits
Black Gold Market is free to follow. Daily XAU/USD analysis with the level, the context and the risk stated before the trade, losing days included, plus an optional Kit for people who want the method written down in one place. There is no promise of profit here, because nobody can honestly make one.
Protect comes first, and knowing what you are actually holding sits ahead of anything you do with a chart. How to protect your capital when gold gets volatile is the pillar this article belongs under. Gold vs silver correlation measures how often the two move together and what that does to portfolio risk, which is the companion piece to this one, how supply and demand affect the price of gold covers the same accounting for gold on its own, and how central banks affect the price of gold goes deeper into the buyer silver does not have.
About the author. Raphael writes Black Gold Market. He works on the part of this business that happens before the trade, the level, the context, and the risk, and on the conviction that a method you can follow through a quiet quarter is worth more than a better one you cannot.
Disclaimer: This article is general educational content about the demand structure of two metals. It is not financial advice, not investment advice, not a recommendation to buy or sell gold, silver or any other asset, and not a solicitation to trade. The demand shares, recycling percentages, byproduct description and world mine production figures are published by the United States Geological Survey in its Mineral Commodity Summary for gold and its Mineral Commodity Summary for silver, both January 2025; the gold split is global consumption excluding exchange traded funds while the silver split is United States domestic use, so the two are not measured on the same scope. Every ratio and every shock calculation is my own arithmetic on those published shares under the assumptions written out in the text, and a share of demand is not a price elasticity, so none of it forecasts a price. No price for gold or silver appears in this article. Trading gold, CFDs and leveraged products carries a high risk of losing money rapidly, and no entry, stop or target discussed should be treated as a signal. Readers should consider their own circumstances and speak to a licensed professional in their jurisdiction.