
Someone in the Black Gold Market group posted a screenshot last week with three horizontal lines drawn across it, labelled R1, R2 and R3, and asked the question properly: what is r1 r2 r3 in trading, and who decides where they go. It is a better question than it looks, because the honest answer changes how much weight you put on those lines for the rest of your career.
Nobody decides where they go. There is no committee, no bank desk, no data provider setting them. R1, R2 and R3 are arithmetic. They are yesterday's high, low and close, put through a formula that has not changed since floor traders worked it out on paper before the open. Once you can do the arithmetic yourself, the lines stop being authority and become what they actually are, which is a summary of the session that just finished.
That distinction is a Protect question, not a chart question. A level you believe in is a level you will size up against. A level you understand is one you can weigh. So let us do the arithmetic, in full, without a single gold price appearing anywhere in this article.
What Is R1 R2 R3 in Trading: The Formula, Written Out
The standard set, sometimes called floor trader pivots, starts with one number and derives the rest from it. You need three inputs from the previous session: its high, its low and its close. Call them H, L and C.
The pivot point itself is the average of those three:
P = (H + L + C) / 3
Then the three resistance levels above it:
R1 = 2P − L
R2 = P + (H − L)
R3 = H + 2(P − L)
That is the whole thing. There is a matching set of support levels, S1, S2 and S3, built the same way in the other direction. Every platform that draws these lines is running exactly this, or a close variant, on whatever high, low and close it has been given.
Read the formulas again and notice what is inside them. H, L and C. Nothing else. No volume, no order flow, no information about who is buying, no measurement of what happened at those prices, no forecast. The only raw material in the entire construction is the shape of one finished session.
What the Levels Actually Measure
Here is where it becomes useful rather than decorative, and here is where I have to do a little algebra to show you something the formula hides.
Because I will not print gold prices in this journal, let me measure everything in the previous session's own range instead. Call that range D, so D = H − L. Then put the low at zero and the high at D, and describe the close by where it finished inside that range: C = kD, where k is zero if the session closed on its low and one if it closed on its high.
Substitute those into the formulas above and the price levels fall away, leaving pure proportions. The distance from the close up to each resistance comes out as:
R1 − C = D(2 − k) / 3
R2 − C = D(4 − 2k) / 3
R3 − C = D(5 − k) / 3
My own arithmetic, and you can check it in a minute with a pen. What it tells you is that R1, R2 and R3 are not distances at all. They are fractions of the previous session's range, and which fraction you get depends entirely on where that session happened to close.
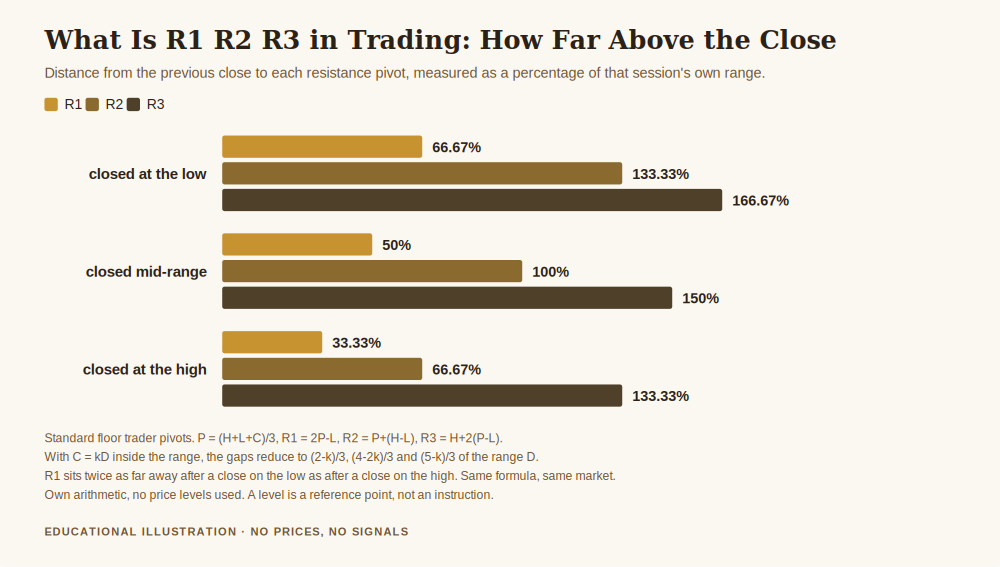
Work through the three rows. If the previous session closed right on its low, R1 sits 66.7 percent of that session's range above the close, R2 sits 133.3 percent above it, and R3 sits 166.7 percent above it. If the same session had closed right on its high instead, with an identical high and an identical low, R1 would sit only 33.3 percent of the range above the close.
Same market. Same day. Same range. Half the distance to R1, purely because the close landed somewhere else.
And notice the collision in the middle of that chart. R1 after a weak close and R2 after a strong close are both 66.7 percent of the range above the close. Two lines with different names, different reputations and, in that pairing, identical meaning. If R1 were a real barrier and R2 were a stronger one, that could not happen.
The Levels Are Not Evenly Spaced, Which Tells You Something
People often describe the pivot set as a ladder, as though the rungs were regular. They are not. The gaps between them come out as:
R2 − R1 = D(2 + k) / 3 and R3 − R2 = D(1 + k) / 3
After a session that closed on its low, the gap from R1 to R2 is twice the gap from R2 to R3. After a session that closed on its high, that reverses exactly. Only the midpoint close, k of one half, spaces them evenly.
This is not a flaw. It is a consequence of the formula being an average, and it is worth sitting with, because it shows you that the spacing of these lines carries no information about the market. It carries information about the arithmetic. A trader who reads “price stalled between R1 and R2” as meaningful is reading a gap whose width was fixed by where a candle closed the day before.
One more consequence, and it is the cleanest of them all. If the previous session's range halves, every distance above halves with it. R1, R2 and R3 are the previous session's range projected forward. Nothing more. In a quiet session they crowd in around the close. After a violent session they stretch a long way out. The lines have not become stronger or weaker; the ruler has changed length.
Why Two Platforms Show You Different Levels
Once you have seen that the whole construction is three inputs and a division, the most common source of confusion resolves itself.
Gold does not have a single daily session in the way a stock exchange does. It trades across the Asian, European and North American hours, nearly around the clock on a working day, which means the phrase “the previous session's high, low and close” is not a fact. It is a choice. Change the window and you change H, L and C, and if you change those you change P, and if you change P then R1, R2 and R3 all move.
So two traders looking at the same instrument, on the same morning, with platforms configured to different session boundaries or fed by different liquidity providers, will genuinely see the pivot lines in different places. Neither platform is broken. They are answering two different questions with the same formula.
It is worth contrasting this with a price that really is authoritative. The LBMA Gold Price is administered independently by ICE Benchmark Administration on an electronic, tradeable and auditable auction platform, run in line with the IOSCO Principles for Financial Benchmarks. That is what a governed reference price looks like: one process, one administrator, one published outcome. Your pivot lines are the opposite of that. They are a calculation your own software performed on data your own broker supplied.
Which is fine, as long as you know it. It stops being fine the moment you treat the output as though it came from somewhere official.
So Are They Useless?
No, and I want to be careful here, because the argument above can be pushed too far.
A pivot level is a compact summary of the last session, drawn in advance, in the same place for everyone using the same window. That gives it two honest uses.
The first is as a measuring stick. Because the levels are fixed fractions of yesterday's range, they tell you how far today has travelled in units of yesterday. Price working above R2 has covered more than a full previous range from the close. That is a factual statement about magnitude, and magnitude is useful context when you are deciding whether a move is ordinary or unusual.
The second is as a shared reference. Enough participants watch these lines that they function as common vocabulary. Not a self-fulfilling prophecy, which is a claim I cannot evidence and will not make, but a coordination point, in the way that round numbers serve as one for a completely different and equally arbitrary reason.
What they cannot do is tell you what happens next. A line calculated from three numbers cannot know about tomorrow's flow, and the algebra above shows there is nothing in it that could. Treat R2 as information about where you are, never as an instruction about what to do. That is the same discipline I argued for in what a support zone actually is, which is the closest relative of this article in the journal.
How I Would Actually Use Them
Three habits, all of them cheap.
Calculate one set by hand, once. Take any finished session, write down its high, low and close, and work out P, R1, R2 and R3 with a calculator. It takes four minutes. Afterwards the lines on your chart will never again look like they came from somewhere else, because you will have made them.
Check where the previous session closed inside its range before you read the levels. That single number, k in the algebra above, tells you whether R1 is sitting close to the market or a long way from it. It is the difference between a level price might touch in an ordinary hour and one it would need an unusual day to reach, and the label R1 does not distinguish between those two situations at all.
Look at the range that produced them. A pivot set built on a violently wide session projects wide, and one built on a compressed session projects tight. If you size positions off distances to these lines without noticing which kind of session generated them, you are letting yesterday's volatility set today's exposure without ever deciding to. That is exactly the mechanism I wrote about in how to protect your capital when gold gets volatile.
None of this makes the levels predictive, and none of it is a signal. It makes them legible, which is the most any indicator built from three numbers can offer.
Get the free Black Gold Market blueprint, a short document on protecting capital before the trade rather than after it, including how to weigh a level instead of obeying it. One email, no spam, unsubscribe anytime.
Get the free blueprint →Frequently Asked Questions
What is R1 R2 R3 in trading, in one sentence?
They are the three resistance levels of the standard pivot set, calculated from the previous session's high, low and close using P = (H+L+C)/3, then R1 = 2P−L, R2 = P+(H−L) and R3 = H+2(P−L), with matching support levels S1, S2 and S3 built the same way below.
Does R stand for resistance?
Yes, R for resistance above the pivot and S for support below it. The naming is a convention from floor trading and it describes position in the calculation, not measured strength. R3 is further from the pivot than R1; it is not evidence of a firmer barrier.
Why do R1, R2 and R3 differ between my platform and someone else's?
Because they are computed from a session window, and gold trades nearly around the clock, so the window is a setting rather than a fact. Different session boundaries, or a different liquidity provider feeding the high, low and close, give different inputs and therefore different lines. Both can be calculated correctly and still disagree.
Is R1 always the same distance from the close?
No, and this is the most common misreading. R1 sits 66.7 percent of the previous range above the close when that session closed on its low, and only 33.3 percent above it when the session closed on its high. Same formula, twice the distance, decided by one candle.
Should I put a stop or a target on one of these levels?
That is a decision about your own risk and your own plan, and this article does not make it for you. What I will say is that the level itself contains no forecast, so any stop or target placed there is being justified by something other than the arithmetic. Know what that something is before you rely on it.
Where did the numbers in this article come from?
Every percentage is my own algebra on the standard pivot formulas, with the assumptions stated in the text: the previous low set to zero, the high set to D, and the close written as kD. No gold price was used and none appears. The description of the LBMA Gold Price and its administration is quoted from LBMA's own page, linked above.
Where Black Gold Market Fits
Black Gold Market is free to follow. Daily XAU/USD analysis with the level, the context and the risk stated before the trade, losing days included, plus an optional Kit for people who want the method written down in one place. There is no promise of profit here, because nobody can honestly make one.
Protect comes first, and knowing what a line on your chart is made of belongs near the start of that. How to protect your capital when gold gets volatile is the pillar this article sits under. What a support zone is covers the same weighing problem for a level you draw by hand, how to read gold's trend and market structure puts individual levels back into a bigger picture, and how to stop depending on trading signals is the same argument applied to the person handing you the level instead of the software drawing it.
About the author. Raphael writes Black Gold Market. He works on the part of this business that happens before the trade, the level, the context, and the risk, and on the conviction that a method you can follow through a quiet quarter is worth more than a better one you cannot.
Disclaimer: This article is general educational content about how standard pivot levels are calculated and what that arithmetic can and cannot tell you. It is not financial advice, not a recommendation to buy or sell any asset, and not a solicitation to trade. It does not endorse any platform, indicator or provider. Every percentage in this article is my own algebra on the stated pivot formulas and stated assumptions, and it is not a measurement of any market. The description of the LBMA Gold Price and its independent administration by ICE Benchmark Administration is quoted from LBMA. No gold price appears in this article. Trading gold, CFDs and leveraged products carries a high risk of losing money rapidly, and no entry, stop or target discussed should be treated as a signal. Readers should consider their own circumstances and speak to a licensed professional in their jurisdiction.