
Somebody in the Black Gold Market group asked me last week how to track hedge fund trades, and whether there is a filing somewhere that shows what the large money is doing in gold before it shows up on a chart. It is a fair question. It also has a real answer, which is rarer than you would think for questions of this shape.
The answer is narrower than most people want, and the narrow part is the useful part. There are two public filings that genuinely tell you something about institutional positioning. One of them is famous, is quoted constantly, and does not contain a single gram of gold. The other one is barely mentioned outside the futures world, covers gold directly, and is roughly forty five times fresher. Almost everybody has the two the wrong way round.
This is a Protect question before it is a research question. A trader who thinks he is watching institutional flow in near real time will size a position on the strength of that belief. If the information is structurally four months old, the belief is doing the sizing and the information is doing nothing. So here is what each filing is, what the rule that creates it actually says, and the arithmetic of how stale it is by the time you read it.
How to Track Hedge Fund Trades, the Two Filings That Actually Exist
Public disclosure of institutional positions in the United States runs through two separate regimes that have nothing to do with each other.
The first is Form 13F, filed with the Securities and Exchange Commission. This is the one that generates headlines every quarter, the one that gets scraped into websites with names like whale tracker, and the one people mean when they talk about following the smart money.
The second is the Commitments of Traders report, published weekly by the Commodity Futures Trading Commission. This one covers futures markets, gold included, and it is the report that actually applies to the market this journal is about.
They differ on three axes: what they cover, how often they arrive, and how old the information is when it reaches you. On all three, the famous one loses. Let us take the rule text first, because the rule text settles most of the argument on its own.
What Form 13F Requires, in the Words of the Rule
The requirement lives at 17 CFR 240.13f-1 in the Code of Federal Regulations. It is short enough to read in a minute, which I recommend, because it is a good habit to check the primary text of anything you are about to build a decision on.
The rule says that every institutional investment manager exercising investment discretion over accounts holding section 13(f) securities, with an aggregate fair market value on the last trading day of any month of at least 100 million dollars, must file a report on Form 13F. The deadline is within 45 days after the last day of the calendar year, and within 45 days after the last day of each of the first three calendar quarters.
Three things in that sentence do the work.
It is a threshold, so managers below 100 million dollars are invisible in this data entirely. It is a snapshot of one day, the last trading day of the quarter, not a record of trading. And it carries a 45 day lag written into the rule itself, which is not a processing delay or an administrative habit. It is the legal deadline, and filers are entitled to use all of it.
The Arithmetic of Reading a 136 Day Old Position
Put those three features together and you can calculate exactly how old the information is when it reaches you. I did this rather than estimate it, because the estimate people carry around in their heads is consistently too small.
Take the third quarter of 2026, which runs from 1 July to 30 September, a span of 92 days. Consider a position opened on the first day of that quarter and still held on the last day. It appears in the snapshot. The filing is then due 45 days after 30 September.
The distance from the first day of the quarter to the last day is 91 days. Add the 45 day deadline and the position is 136 days old at the moment you are legally entitled to read about it. That is four and a half months.
The freshest possible item in the same filing is a position opened on the very last day of the quarter, which is still 45 days old when it becomes public. There is no fresher number in the document. Forty five days is the floor, not the average.
Against that, the Commitments of Traders report is built on a Tuesday snapshot released the following Friday, a lag of 3 days. So the famous filing is between 15 and 45.3 times staler than the obscure one, depending on which position inside it you happen to be looking at, and you have no way to tell which is which.
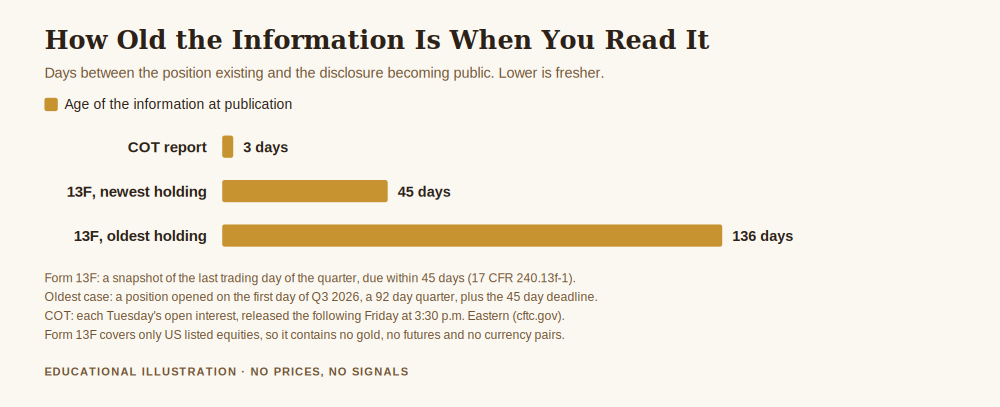
There is a fourth case that the chart cannot show, and it is the worst one. A position opened and closed inside the same quarter never appears at all. The snapshot only sees what was there on the final day. A manager who bought in July, rode it, and sold in September leaves no trace in the document. You are not reading a trading record. You are reading one photograph per quarter, developed after a month and a half.
The Line in the Rule That Matters More Than the Delay
Everything above is about time, and time is the objection people usually raise. It is not the objection that should end the discussion for anyone here.
Read paragraph (c) of the same rule. It defines section 13(f) securities as equity securities of a class described in section 13(d)(1) of the Act that are admitted to trading on a national securities exchange or quoted on the automated quotation system of a registered securities association. In plain terms: shares listed on an American stock exchange.
So run the list for a gold trader. Spot gold: not an equity, not listed, zero lines. Gold futures: a futures contract, not a security under this rule, zero lines. Currency pairs: zero lines. Contracts for difference on any of the above: zero lines.
A gold mining company's shares appear, because those are listed equities. A gold exchange traded fund's shares appear for the same reason. But a mining share is a business with a balance sheet, employees, jurisdictions and hedging policies, and it is not gold. Reading a manager's mining shares to infer his view on the metal is two inferences stacked on a photograph that is up to 136 days old.
Which means the honest summary is this: for the market this journal covers, Form 13F contains nothing. Not stale information about gold. No information about gold. The most quoted institutional filing in the world is silent on the instrument you are trading.
The Report That Does Cover Gold, and Its Three Day Lag
The Commitments of Traders report is the one that applies. The CFTC publishes it and explains its own mechanics plainly on the About the COT Reports page.
It provides a breakdown of each Tuesday's open interest for markets in which 20 or more traders hold positions at or above the reporting levels the CFTC sets. The futures only and the futures and options combined reports are released every Friday at 3:30 p.m. Eastern time. Gold futures qualify, so gold gets its own weekly breakdown of who is holding what, split into commercial and non commercial categories, with the number of traders in each.
Three days old, weekly, and about gold. Compared with a quarterly photograph that is at best 45 days old and contains no gold at all, this is not a close contest. The report almost nobody in a retail gold group has opened is the one built for the market they are in.
It still is not a crystal ball, and I want to be exact about why. It is a count of positions, not of intentions. A commercial hedger holding a large short position is not predicting a fall, he is hedging inventory he already owns, and reading that as a bearish view is a category error people make constantly. The categories tell you the composition of open interest. They do not tell you what happens next.
The 200 Contract Line You Are Almost Certainly Below
One more number, because it changes how you read the whole thing. The reporting levels are published at 17 CFR 15.03, and for gold the level is 200 contracts.
A COMEX gold contract is 100 troy ounces, so a trader becomes individually reportable at 20,000 ounces. Below that line, positions are not broken out by category at all. They are aggregated into a single nonreportable column.
Two consequences follow, and they point in opposite directions.
The first is humbling. If you are trading a retail account, you are in the nonreportable column. You are part of an aggregate, you are not visible, and no institution anywhere is watching your position and deciding what to do about it. That thought is worth sitting with on the days it feels otherwise.
The second is more useful. Because the categories only capture traders above the line, the report describes the behaviour of a specific and fairly small population. It is not the market. It is the reportable part of the market, which is a real thing to know but a smaller thing than the phrase institutional positioning suggests.
Get the free Black Gold Market blueprint, a short document on protecting capital before the trade rather than after it, including how to decide what a piece of information is actually worth before you size anything on it. One email, no spam, unsubscribe anytime.
Get the free blueprint →What to Do With Information That Is Structurally Late
The instinct after reading all this is to conclude that the filings are useless and to stop there. That is the wrong conclusion, and it wastes something real.
Late information is not worthless information. It is just information that cannot be used for timing. A four month old photograph tells you nothing about this week, and it does tell you how a category of holders behaved through an entire quarter that has already happened. Those are different questions, and the second one is a legitimate thing to study.
So the working rule I use is simple enough to state in one line: match the age of the information to the length of the decision.
A weekly report with a three day lag can inform a view you hold for weeks. A quarterly snapshot with a 45 day floor can inform a view you hold for quarters, about instruments it actually covers, which for gold means it cannot inform anything. Neither one can inform a decision you are making this afternoon, and any service that presents either as a live feed of what the big money is doing right now is selling you a photograph and calling it a window.
The trap is not that people read these filings. It is that they read them and then trade at a speed the data cannot support, which converts a research habit into a sizing error. The data was late. The position was not.
If you take one thing from this: the reason to look up how to track hedge fund trades is not to copy anybody. It is to find out how much of what you thought was visible actually is. In gold, the honest answer is a weekly count of the reportable half of the market, three days old, with no intentions attached. That is a genuinely useful thing to have. It is also considerably less than the story implies, and knowing the difference is worth more to your capital than the data itself.
Frequently Asked Questions
How to track hedge fund trades in gold specifically?
Through the CFTC Commitments of Traders report, not Form 13F. Form 13F covers only section 13(f) securities, meaning equities listed on a United States exchange, so spot gold, gold futures and currency pairs never appear in it. The COT report covers gold futures directly and is released every Friday at 3:30 p.m. Eastern on a Tuesday snapshot.
How old is the information in a 13F filing?
Between 45 and 136 days, depending on when inside the quarter the position was opened. The rule requires filing within 45 days of the quarter end, and a position opened on the first day of a 92 day quarter is 136 days old at that deadline. My calculation, using the deadline in 17 CFR 240.13f-1 and the calendar length of the third quarter of 2026.
Do all hedge funds have to file a 13F?
No. The rule applies to institutional investment managers with at least 100 million dollars in section 13(f) securities. Managers below that threshold, and managers holding assets outside that definition, do not appear.
Can I see individual traders in the COT report?
No. Positions are grouped into categories, and a trader only counts toward the reportable categories once he is at or above the reporting level, which for gold is 200 contracts, or 20,000 ounces, under 17 CFR 15.03. Everything below that is aggregated into a single nonreportable figure with no names and no breakdown.
Does a large short position in the COT report mean the price will fall?
It does not. The report counts positions, not views. Commercial participants hold futures against physical inventory and business exposure, so a large commercial short can reflect hedging rather than any opinion about direction. Treating a position count as a forecast is the most common misreading of this data.
Where did the numbers in this article come from?
The 100 million dollar threshold, the 45 day deadline and the definition of section 13(f) securities are the text of 17 CFR 240.13f-1. The 200 contract reporting level for gold is 17 CFR 15.03. The Tuesday snapshot, the Friday 3:30 p.m. Eastern release and the 20 trader condition are published by the CFTC. The 136 days, the 15 times and 45.3 times ratios and the 20,000 ounce conversion are my own arithmetic on those published figures, with the assumptions stated in the text. No gold price appears anywhere in this article.
Where Black Gold Market Fits
Black Gold Market is free to follow. Daily XAU/USD analysis with the level, the context and the risk stated before the trade, losing days included, plus an optional Kit for people who want the method written down in one place. There is no promise of profit here, because nobody can honestly make one.
Protect comes first, and knowing what your information is actually worth sits ahead of anything you do with it. How to protect your capital when gold gets volatile is the pillar this article belongs under. How to stop depending on trading signals is the companion piece, because following a filing and following a signal fail in the same way, and how central banks affect the price of gold covers the one institutional buyer whose gold activity genuinely is published, unlike the funds discussed here.
About the author. Raphael writes Black Gold Market. He works on the part of this business that happens before the trade, the level, the context, and the risk, and on the conviction that a method you can follow through a quiet quarter is worth more than a better one you cannot.
Disclaimer: This article is general educational content about public regulatory filings and what they do and do not disclose. It is not financial advice, not investment advice, not a recommendation to buy or sell gold or any other asset, and not a solicitation to trade. The reporting threshold, filing deadline and definition of section 13(f) securities are quoted from 17 CFR 240.13f-1, the gold reporting level from 17 CFR 15.03, and the release schedule from the CFTC Commitments of Traders documentation. Every derived figure is my own arithmetic on those published values under the assumptions written out in the text. Rules change and deadlines are amended, so check the current text before relying on any of it, and nothing here is legal or tax advice. Trading gold, CFDs and leveraged products carries a high risk of losing money rapidly, and no entry, stop or target discussed should be treated as a signal. Readers should consider their own circumstances and speak to a licensed professional in their jurisdiction.