

Almost everyone who asks how to increase win rate in trading is asking a reasonable question for an uncomfortable reason. The question sounds like it is about skill. Most of the time it is about relief, because a losing trade feels like a verdict on you and a winning trade feels like a pardon, and a higher win rate promises more pardons.
I can give you the answer in a single line and then spend the rest of this article showing you the receipt. You can raise your win rate to almost any number you like, this afternoon, without learning anything and without becoming a better trader. You do it by moving your exits. What you cannot do is raise it for free. As always in this journal, no entry, stop or target discussed should be treated as a signal.
The Short Answer Nobody Sells You
A win rate measures the shape of your exits far more than it measures the quality of your decisions. Put your target close to your entry and your stop far away, and most trades will touch the target before they touch the stop. That is not insight. That is geometry. The price only has to travel a short distance in your favour and a long distance against you, so the short distance wins more often.
The trap is that this feels like progress. Your journal fills with green. The ratio you quote to yourself goes up. And the account does not follow, because each win is small and each loss is large, and the arithmetic that actually governs your equity never had win rate as its main term.
Rather than assert that, I measured it.
The Measurement
I used the published LBMA daily gold benchmark, the afternoon fixing, over the ten complete calendar years from 2016 to 2025. That is 2,506 benchmark days and 2,505 day-on-day comparisons.
The test is deliberately stupid, and that is the point. On every single day I open a position. I set a target a fixed percentage away and a stop a fixed percentage away. Then I walk forward through the following benchmark days and record which one the price reached first, giving up after twenty sessions and closing at whatever the price is then. No forecasting, no filters, no reading of conditions. A rule so simple it contains no skill at all.
Then I ran it again with different target and stop distances, and watched the win rate move.
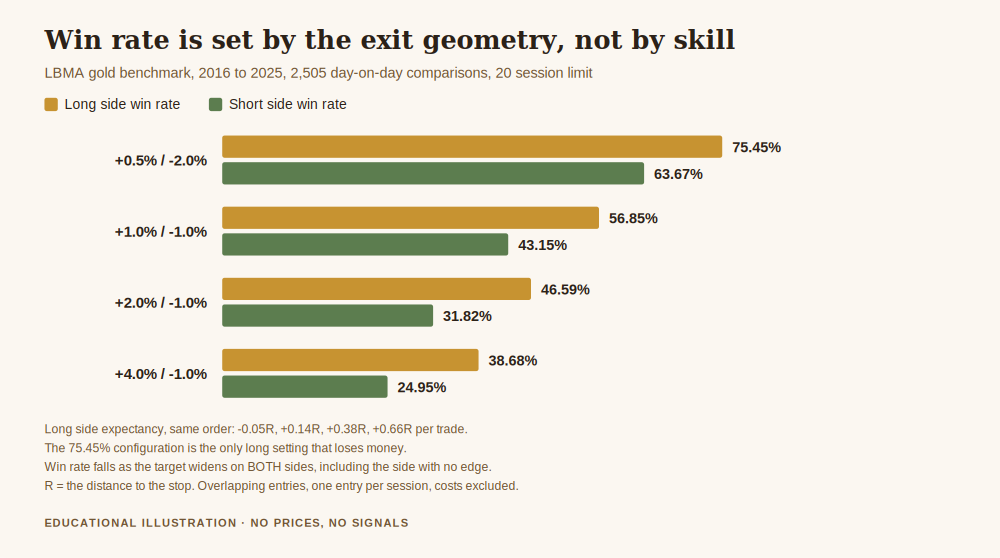
Read the gold bars from top to bottom. A target of 0.5 percent against a stop of 2 percent won 75.45 percent of the time. Widen the target to 4 percent and tighten the stop to 1 percent, and the same rule on the same data won only 38.68 percent of the time.
That is a swing of nearly thirty seven percentage points, produced by nothing except where I chose to put two lines. No strategy was improved. No market was understood. I simply asked the price to do something easier.
How to Increase Win Rate in Trading, and the Bill That Arrives With It
Now the part that the win rate hides. Alongside each of those tests I recorded expectancy, which is the average amount won or lost per trade, measured in R, where one R is the distance to the stop. Expectancy is the number your equity curve actually obeys.
Here they are, in the same order as the chart:
- Target 0.5 percent, stop 2 percent: win rate 75.45 percent, expectancy minus 0.05R per trade.
- Target 1 percent, stop 1 percent: win rate 56.85 percent, expectancy plus 0.14R.
- Target 2 percent, stop 1 percent: win rate 46.59 percent, expectancy plus 0.38R.
- Target 4 percent, stop 1 percent: win rate 38.68 percent, expectancy plus 0.66R.
The configuration with the highest win rate is the only one that loses money. The configuration with the lowest win rate earns the most per trade. The ranking by win rate is not merely a poor guide to the ranking by profitability, it is very nearly the reverse of it.
Sit with that before you read on, because it explains a category of trader you have certainly met and may have been. The person who is right most of the time and poor anyway is not unlucky and is not being sabotaged by the market. They have optimised the number they were watching, and it was the wrong number.
The Control That Rules Out Luck
There is an obvious objection to everything above. Gold rose a great deal across that decade, more than tripling by the end of it. A rule that buys every day is going to look flattered by that. Fair.
So I ran the whole thing again on the short side, selling every day instead of buying. That side has no drift working for it. In this window it is a losing approach and it should be, and the expectancy numbers confirm it: every short configuration lost money.
Look at the olive bars anyway. The short side wins 63.67 percent of the time with the tight target and the wide stop, and 24.95 percent of the time with the wide target and the tight stop. Same monotonic slide, same cause.
This is the finding that matters. A strategy with no edge at all, one that reliably loses money, still produces a win rate above sixty percent if you shape its exits that way. The 63.67 percent figure comes with an expectancy of minus 0.20R per trade, which is the worst of any configuration I tested on either side.
A high win rate is therefore not weak evidence of an edge. On its own it is no evidence of an edge whatsoever. It is compatible with an excellent strategy, and it is equally compatible with a strategy that is systematically wrong.
What a Win Rate Can and Cannot Tell You
None of this makes the number worthless. It makes it a description rather than a score.
What it can tell you. Held next to your average win and average loss, a win rate lets you compute expectancy, and expectancy is the thing worth knowing. It also tells you what your equity curve will feel like to live through. A rule that wins 38 percent of the time will hand you long stretches of red even while it makes money, and you need to know that in advance, because the version of you that meets an unexpected losing run at midnight is not the version that designed the plan.
What it cannot tell you. Whether the approach makes money. Whether you have an edge. Whether one trader is better than another. A win rate quoted with no mention of the size of the wins and losses is not a statistic, it is a decoration, and you should treat anyone who quotes it that way accordingly.
This is also why comparing your win rate against a stranger's is meaningless even when both are honestly reported. You are comparing two exit geometries, not two levels of ability.
What to Measure Instead
Replace the question. Instead of asking how to increase win rate in trading, ask what you would need to know to tell whether this approach is worth running at all. Four things, in this order.
Expectancy per trade
Average result per trade in R. Positive means the approach adds something. Negative means it takes something away, no matter how often it is right. This single number outranks every other statistic in your journal, and it is arithmetic rather than opinion.
The size of the sample behind it
Expectancy computed over eleven trades is a rumour. The uncomfortable truth is that separating a real edge from ordinary noise takes far more trades than most people have taken, which is the subject of how to test your trading strategy. Until the sample is large enough, the honest description of your edge is that you do not yet know.
The worst run the approach contains
Every method has a losing streak inside it that you have not met yet. A 38 percent win rate will produce runs of consecutive losses that feel like the method has broken, and it will produce them routinely. Knowing the shape of that in advance is what keeps you from abandoning something sound at its worst moment, and it is the practical half of drawdown and recovery.
Whether you can actually sit through it
This one is not a statistic and it is the one that decides outcomes. A method with better expectancy that you will abandon in month three is worth less to you than a slightly worse one you will run for three years. That is a real constraint, not a weakness, and it deserves to be designed for rather than apologised for.
Notice that the answer to the original question is now available to you, and it has stopped being interesting. If you want a higher win rate, take profit sooner and give the trade more room against you. You will be right more often. You will make less, and past a certain point you will make nothing at all. The dial exists. It is simply connected to a different machine than people assume.
Protect, Master, Grow
The protective reading of all this is straightforward. Do not let a comfortable number make decisions that only expectancy is qualified to make. A trader chasing a higher win rate will naturally drift towards small targets and wide stops, which is exactly the configuration that turned positive expectancy negative in the test above. The drift is gradual, it feels like discipline, and it is measurable only if you are measuring the right thing.
The mastery reading is that you should be able to state your own numbers from your own records: expectancy in R, sample size, longest losing run, largest drawdown. Four numbers. Most traders cannot produce any of them and can quote their win rate instantly, which tells you which one is being managed.
The growth reading is the quiet one. Nothing compounds through an approach you abandon, and nothing compounds through a negative expectancy however green the journal looks. Both failures are avoided by the same habit, which is measuring the thing that governs the account rather than the thing that governs your mood.
Get the free Black Gold Market blueprint, a short document for writing down your reason, your risk and your exit before the trade, so that afterwards you can measure expectancy instead of counting wins. One email, no spam, unsubscribe anytime.
Get the free blueprint →Frequently Asked Questions
What is a good win rate in trading?
There is no such thing in isolation, and that is the honest answer rather than an evasive one. A 38 percent win rate was the best performing configuration in the test above and a 75 percent win rate was the only losing one. A win rate is good or bad only in combination with the average size of your wins and losses. Ask for expectancy instead, and if someone quotes a win rate without the payoff alongside it, they have told you nothing.
Can I really raise my win rate just by moving my exits?
Yes, and the effect is large. Moving from a 4 percent target with a 1 percent stop to a 0.5 percent target with a 2 percent stop took the win rate on the same data from 38.68 percent to 75.45 percent. Nothing else changed. The market did not become more readable, and the person running the rule did not improve.
So is a high win rate a bad sign?
Not bad, just uninformative on its own. Plenty of sound approaches have high win rates and pair them with tight risk control. The warning is that a high win rate is equally consistent with a losing method, which the short side of the test demonstrates: 63.67 percent right, and the worst expectancy of anything measured. Treat the number as a description of your exits, not as a report card.
Why did the tight target lose money when it won three times out of four?
Because the wins were a quarter of the size of the losses. Winning 0.25R three times and losing 1R once leaves you slightly behind, and the test came out at minus 0.05R per trade. The frequency of being right was never in question. The amount collected for being right was too small to pay for the amount surrendered when wrong.
How many trades before my own win rate means anything?
More than you have, in most cases, and considerably more than feels intuitive. Short sequences are dominated by luck in both directions, which is why a strong month proves very little and a poor one proves no more. The reasoning behind that, with the arithmetic, is in trading is a game of probability.
Does this apply to instruments other than gold?
The mechanism does, because it is geometry rather than anything specific to gold. The exact figures would come out differently on a different instrument or a different decade, and you should not carry my numbers across to your own market. Carry the method instead. The data source is linked above and the rule is simple enough to rebuild in an afternoon.
Should I stop tracking win rate altogether?
No. Keep recording it, because you need it to compute expectancy and because it tells you what the equity curve will feel like to sit through. Just stop treating it as the score. It belongs in the same column as the number of trades you took, useful context that decides nothing by itself.
Where This Leaves You
The question that opened this article has a real answer, and the answer is that the dial is right there and it is not worth turning. Move your target closer and your stop wider and you will be right more often, feel better on more evenings, and end the year with less. That trade is available to anyone at any time, which is precisely why it needs to be named.
What is worth having instead is duller and it lasts. Know your expectancy. Know how many trades it rests on. Know the worst run inside the method before the method shows it to you. And know whether you are built to sit through that particular shape of discomfort, because the finest expectancy in the world is worth nothing if you close the account in the middle of the drawdown it always contained.
Being right is a feeling. Expectancy is a number. Only one of them pays.
If you want that in a form you can keep, the Black Gold Market blueprint is free. It is a short document, not a course. There is nothing to buy in order to follow along, and an optional Kit if you want more structure later. We do not sell certainty, and we publish no profit claims. The companion piece on the protection side is how to protect your capital when gold gets volatile.
About the author. Raphael writes the Black Gold Market journal. He works on the view that most accounts are lost to structure rather than to analysis, and that the level, the context and the risk are worth more attention than the entry.
Disclaimer: This article is general educational content about how win rate, payoff and expectancy relate to one another. It is not financial advice, it is not a recommendation to buy, sell or hold anything, and nothing in it should be read as a view on where any price is going. The target and stop distances used in the test are illustrative parameters chosen to demonstrate an arithmetic point, they are not suggested settings, and no entry, stop or target discussed should be treated as a signal. Trading gold, CFDs and leveraged products carries a high risk of losing money rapidly. All win rate, expectancy and day count figures are computed from the published LBMA daily gold benchmark over 2016 to 2025, using the method stated in the article, with costs and slippage excluded and overlapping entries permitted, and the source is linked so you can check it. Results measured on one instrument over one decade describe the past and are not a forecast. No price levels are quoted anywhere in this article.