


The Question Behind the Question
When someone asks me how to get better at trading, they usually mean which tool they are missing. A better indicator, a better setting, a better combination. The assumption underneath is that improvement arrives from outside, in the form of something they have not found yet.
I want to test that assumption rather than argue with it, because it can be tested. Below I took the most widely taught indicator rule there is and measured it against ten years of real gold data. Then I will show you what the number implies about where improvement actually comes from. As always here, no entry, stop or target discussed should be treated as a signal.
Testing the Most Popular Rule in the World
The rule almost everyone learns first: if price is above its moving average the trend is up, if below it the trend is down. Fifty days is the most common setting.
So I ran it. Using the LBMA Gold Price afternoon benchmark, the London fix used across the industry for settlement, over ten complete years from 1 January 2016 to 31 December 2025. That is 2,506 published benchmark days, and the test ran on 2,455 of them once the first fifty days were used to build the average.
Two assumptions stated openly. A "day" is one benchmark publication, so weekends and London holidays do not exist in the series. And the test asks one narrow question: when price sat above its fifty day average, did the next benchmark come in higher.
The rule was right 51.41 percent of the time.
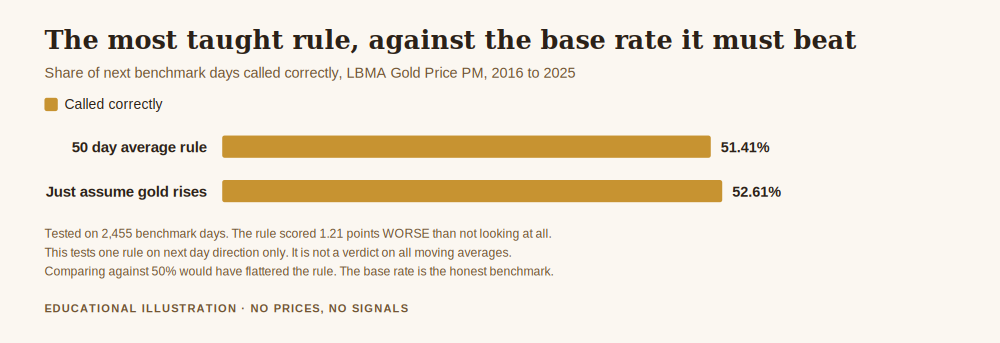
Slightly better than a coin flip, which sounds like a mild endorsement until you compare it against the right thing.
Over the same period, gold simply closed higher than the previous benchmark on 52.61 percent of days. That is the base rate. It is what you would have scored by ignoring the chart entirely and saying "up" every single morning without looking.
So the fifty day moving average rule scored 1.21 percentage points worse than not looking at all.
What That Does and Does Not Prove
I want to be careful here, because this is exactly the kind of number that gets overstated.
It does not prove moving averages are useless. It tests one specific rule, on one instrument, over one ten year window, judged on next day direction only. Plenty of sensible approaches use a moving average for something other than predicting tomorrow, as a filter, as a way of describing context, as a line that keeps you out of chop. None of that is measured here.
What it does establish is narrower and more useful: the indicator on its own carries no forecasting power worth having. The thing that everyone learns first, and that a great deal of educational material is built around, does not beat a rule so simple it requires no chart.
And that has a direct consequence for the question we started with. If the tool is not where the difference lives, then collecting more tools is not improvement. It feels like improvement, because learning a new indicator produces the sensation of progress, but the measurement says the sensation is not tracking anything.
Where the Difference Actually Lives
If not in the tool, then where. Three places, in order of how much they matter.
In what you do with a losing run. This is the largest and least discussed. Consider a trader with a genuine edge winning 55 percent of the time, an arbitrary figure used here only to demonstrate arithmetic. Across 100 trades, the probability of hitting at least one run of five losses in a row is 64.7 percent. Not a risk. The likely outcome.
Five in a row feels like the method has stopped working. It has not. It is what a 55 percent edge looks like from the inside, roughly two times in three. The trader who reduces size, changes approach, or stops during that run has converted an ordinary feature of the process into a permanent change of course, and has done so at the worst possible moment.
In how you size. Nothing else compounds like this, in both directions, and it is entirely within your control on every single trade. It is the subject of position sizing so one trade cannot hurt you.
In whether you actually review. Which brings us to the part that does produce improvement.
Reviewing Your Own Trades, Properly
Almost everyone keeps some record. Very few review it in a way that can teach them anything, because they review the wrong column.
The instinct is to sort by profit and loss and study the losers. That feels rigorous and it is close to useless, because on the numbers above a loss tells you almost nothing. Within any real edge, individual losses are expected, frequent, and carry no information about whether the decision was sound.
The review that works separates the decision from the outcome. Four boxes, and you want to know how full each one is:
- Good decision, good outcome. The process working. Nothing to change.
- Good decision, bad outcome. Normal. The cost of doing business. Changing anything here is the most expensive mistake in the whole exercise.
- Bad decision, good outcome. The genuinely dangerous box. You broke your own rule and got paid for it, and the reward makes it far more likely you do it again. These need finding precisely because nothing hurt.
- Bad decision, bad outcome. The only box that deserves a change, and the easiest to learn from.
To sort trades into those boxes you need one thing recorded that most journals leave out: what you expected and why, written before the trade closed. Without that, you are judging your past self using information they did not have, which is not review, it is hindsight.
Record the reason, the level, the risk and what would make you wrong. Then, when you sit down monthly, you can ask the only question that improves anything: which of my rules did I break, and what did it cost me over the whole set, not on one trade.
This is also why the 55 percent example matters for review. If a five loss run is likely rather than exceptional, then a month of losses is not evidence that your method failed. It might be. It also might be Tuesday. Only the process column can tell you which, and only if you wrote it down at the time.
What Improvement Looks Like on a Chart of Your Own Behaviour
Here is a way to make progress visible while your account balance is still too noisy to read.
Count, each month, the number of trades where you broke your own written rule. That is your error rate, and unlike your profit and loss it responds to effort within weeks rather than years. A trader whose rule breaks fall from nine a month to two has improved measurably, whatever the balance did over the same period.
The balance will follow eventually, or it will tell you the method itself is wrong, and both of those are useful. But the error rate is the number you can actually move this month, and it is the one that separates people who get better from people who merely get more experienced.
If sitting still through a losing run is the part you find hardest, how to reduce drawdown in trading deals with the exposure side, and how to protect your capital when gold gets volatile is the piece I would read first.
Get the free Black Gold Market blueprint, a short document for writing down your reason and your risk before the trade, so the review afterwards has something honest to work with. One email, no spam, unsubscribe anytime.
Get the free blueprint →Frequently Asked Questions
So how to get better at trading, in one sentence?
Stop collecting tools, start recording your reasoning before the outcome is known, and review decisions rather than results. The measurement above suggests the tool is not where the difference lives, and the streak arithmetic suggests most people change course during runs that were always going to happen.
Does the 51.41 percent figure mean I should stop using moving averages?
No, and I would be uncomfortable if that were the takeaway. It means one specific rule, judged on next day direction, did not beat simply assuming gold rises. Moving averages used as context or as a filter are doing a different job that this test does not measure. The point is about where to spend your attention, not a verdict on a line.
Why compare against 52.61 percent instead of 50 percent?
Because 50 percent is the wrong benchmark. Gold rose on more days than it fell over this period, so a rule has to beat the base rate of the thing itself, not a coin. Comparing against 50 would have made the rule look like a mild success when it was actually behind. Choosing the right thing to compare against is most of honest measurement.
How many trades should I review at once?
Enough that a streak cannot dominate the picture, which in practice means monthly rather than weekly, and by category rather than one by one. Reviewing after each loss is how you end up changing a working method during a run that the arithmetic said to expect.
What if my review says I follow my rules and still lose?
Then you have learned something genuinely valuable, and far faster than most people do: the problem is the method, not the execution. That is a solvable problem. It is the trader who cannot tell those two apart who stays stuck, because they keep fixing the half that was not broken.
Is experience the same as improvement?
No, and conflating them costs years. Experience accumulates automatically with time. Improvement only happens where there is a recorded expectation to compare against, which is why two traders with five years each can be in completely different places.
Where This Leaves You
The uncomfortable finding in this article is not that a moving average scored 51.41 percent. It is what that implies about how most people spend their first few years.
Studying tools feels like work, produces a sense of progress, and is measurable in hours spent. Recording your reasoning before you know the outcome feels like admin, produces no sensation of progress at all, and is the only one of the two that gives you something to learn from later.
Improvement is not hidden in a setting you have not tried. It is in the gap between what you said you would do and what you did, which is invisible unless you wrote the first part down. That is unglamorous, and it is the whole of it.
If you want that in a form you can keep, the Black Gold Market blueprint is free. It is a short document, not a course. There is nothing to buy to follow along, and an optional Kit if you want more structure later. We do not sell certainty, and we publish no profit claims.
About the author. Raphael writes the Black Gold Market journal. He works on the view that most accounts are lost to structure rather than to analysis, and that the level, the context and the risk are worth more attention than the entry.
Disclaimer: This article is general educational content about measurement and review in trading. It is not financial advice and it is not a recommendation to buy or sell anything. Trading gold, CFDs and leveraged products carries a high risk of losing money rapidly. No entry, stop or target discussed should be treated as a signal. The 55 percent win rate used above is an arbitrary illustration chosen to demonstrate probability arithmetic, not a target, forecast or claim about results. The moving average test and base rate are computed from the published LBMA Gold Price PM benchmark for 2016 to 2025 with the assumptions stated in the article, and the external source is linked so you can check it.