

The Question Everyone Asks the Wrong Way Round
Ask ten traders what is better swing trading or day trading and you will get ten answers, all of them about temperament. You will be told day trading suits decisive people, that swing trading suits patient ones, that it depends on your personality and your schedule. None of that is untrue. All of it skips the part that can actually be measured.
There is an arithmetic answer sitting underneath the preference, and it has nothing to do with what kind of person you are. It has to do with two quantities that behave very differently as you hold a position longer. One of them is how far the market travels. The other is how much you pay to be there. They do not scale together, and the gap between them is the entire subject.
I want to walk through it with real numbers rather than assertions. As always here, no entry, stop or target discussed should be treated as a signal.
What the Gold Benchmark Actually Does
The measurements below come from the LBMA Gold Price, the London benchmark used across the industry for settlement and valuation. I took the afternoon series and measured ten complete years, 1 January 2016 to 31 December 2025, which is 2,506 published benchmark days.
Two assumptions, stated openly so you can judge them. A "day" here is one benchmark publication, so weekends and holidays do not appear, which averages 250.6 benchmark days a year. And every figure is measured benchmark to benchmark, so intraday swings are invisible. That second point matters, and I will come back to it, because it is the strongest argument the day trading side has.
Here is what the series says about distance travelled:
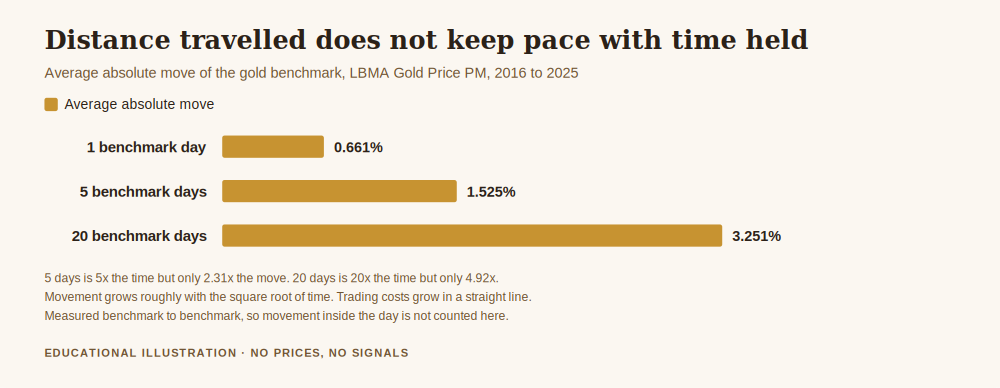
- Over one day, the average absolute move was 0.661 percent.
- Over five days, roughly a trading week, it was 1.525 percent.
- Over twenty days, roughly a trading month, it was 3.251 percent.
Now look at those three numbers as ratios rather than levels, because that is where the answer lives.
Five days is five times as long as one day, but the move is only 2.31 times larger. Twenty days is twenty times as long, but the move is only 4.92 times larger. Distance does not grow in step with time. It grows far more slowly, roughly with the square root of it, which is the ordinary behaviour of a market whose day to day direction is close to a coin flip.
What Is Better Swing Trading or Day Trading Depends on What Scales
Here is the pivot. Movement grows slowly with time held. Cost does not. Cost grows in a straight line with the number of times you open and close.
Put the two together. A trader taking one position a day pays the spread and commission five times over a week to be exposed to a market that moved 1.525 percent. A trader holding one position for that week pays it once, for the same 1.525 percent. Same market, same distance, one fifth of the toll.
Stretch it to a month and it gets starker. Twenty round trips to capture 3.251 percent, or one round trip to capture the same 3.251 percent. The market does not know or care which of the two of you is watching it.
This is the honest core of the comparison, and it is why the question is usually asked the wrong way round. The choice is not between two styles that suit different personalities. It is a choice about how many times you are willing to pay a toll on a road whose length you do not control.
I should be fair to the other side, because this argument has a real limit.
The Case for the Shorter Horizon, Made Properly
Benchmark to benchmark measurement understates what happens inside a day. Gold can travel a great deal between one afternoon fix and the next while ending up near where it started, and a day trader is not trying to capture the net move. They are trying to capture a piece of the path, which is longer than the distance between the endpoints.
So the numbers above do not prove day trading cannot work. What they establish is narrower and more useful: the net drift is not what pays a day trader. If you trade intraday, your edge has to come from capturing path, not direction, and it has to do so by a margin large enough to cover paying the toll five to twenty times more often.
That is a demanding requirement, and it should be stated as one rather than waved at. It is also a genuine one. Some people meet it.
The shorter horizon has two other real advantages worth naming. You carry no overnight exposure, so a gap while you sleep cannot reach you. And your feedback loop is faster, which means you learn from more repetitions in a given month, provided you are actually recording them and not merely accumulating them.
What This Does to Capital, Which Is the Part I Care About
Everything above is about returns. Now the side of the ledger this journal exists for.
Frequency multiplies exposure to your own worst decisions. Twenty decisions a month means twenty opportunities to size up after a loss, twenty chances to move a stop because the position is uncomfortable. One decision a month means one. Nothing about your discipline changes between those two lives, but the number of times it is tested changes by a factor of twenty.
This is not a small point dressed up. The regulators have measured the outcome of the population that trades this way. The European Securities and Markets Authority, introducing its product intervention measures on contracts for difference, reported that national analyses across EU jurisdictions found 74 to 89 percent of retail accounts typically lose money, with average losses per client ranging from 1,600 to 29,000 euros.
That band is wide because different regulators measured different populations, and I would rather quote it honestly than sharpen it. What it tells you is that the base rate for retail leveraged trading is poor everywhere it has been examined. It does not separate swing traders from day traders, so I will not claim it does. But the mechanism that produces those losses, paying costs repeatedly while sizing emotionally, is mechanically amplified by frequency.
The swing horizon is not safer because it is calmer. It is safer, when it is, because it gives you fewer chances to hurt yourself, and because more of the market's movement is on your side of the toll booth. Whether you use that safety is a separate question, which is why position sizing so one trade cannot hurt you matters regardless of which horizon you pick.
The Costs Nobody Puts in the Comparison
Two more items belong on the sheet, and they cut in opposite directions.
Financing. Holding a leveraged position overnight normally incurs a swap charge, and the swing trader pays it every night while the day trader pays nothing. Over a month this is a real number and it partly offsets the spread saving. Whether it fully offsets it depends entirely on your broker's rates and on which direction you hold, so the only correct move is to look up your own and do the sum rather than accept either side's version.
Time. A daily operator makes roughly 250 decisions a year. A monthly operator makes about 12. That difference is not merely convenience. It is the difference between an activity that must fit around your working life and one that will quietly consume it, and the honest answer for most people with a job is that the shorter horizon is not available to them at any price.
How to Actually Decide
Not by personality quiz. By three questions you can answer with facts you already have.
What does a round trip cost you, as a percentage? Look up your typical spread and commission on gold and express it as a percentage. Now compare it to 0.661 percent, the average absolute daily move. If your round trip cost is an appreciable fraction of that, the daily horizon is asking you to be right by a large margin simply to break even, and the arithmetic is telling you something before you have taken a single position.
How many hours can you honestly give this, every week, for a year? Not your best week. Your ordinary one. A horizon you cannot maintain in a busy month is not a strategy, it is an intention.
How do you behave after three losses in a row? You already know the answer. If the truthful answer is that you size up, then frequency is your enemy and you should pick the horizon that asks you the question less often. How to reduce drawdown in trading deals with the mechanics of that directly.
Notice that none of these ask which style is better in the abstract. There is no such answer. There is only which one your costs, your calendar and your temperament can carry, and those are three things you can measure this week.
Get the free Black Gold Market blueprint, a short document for writing down your horizon, your costs and your risk while you are calm, so the version of you under pressure has something to follow. One email, no spam, unsubscribe anytime.
Get the free blueprint →Frequently Asked Questions
So what is better swing trading or day trading, in one sentence?
For most people with a job and ordinary retail costs, the longer horizon is the easier arithmetic, because market movement grows with roughly the square root of time while your costs grow in a straight line with your trade count. That is a statement about arithmetic, not about which one you will personally do well at.
Does the 2.31 times figure mean a week is only worth twice a day?
In terms of net distance between endpoints, yes, that is what ten years of the benchmark says. It does not mean a week contains only twice as much opportunity, because the path travelled within that week is much longer than the endpoints suggest. The figure is about what a position held passively captures, which is the right comparison for a swing approach and the wrong one for an active intraday approach.
Is swing trading safer than day trading?
Not inherently, and I would not want that to be the takeaway. A badly sized swing position held through a weekend can do more damage than a month of small intraday trades. What the longer horizon reduces is the number of decisions, and therefore the number of chances to make an emotional one. Sizing still decides whether you survive.
What about the swap cost of holding overnight?
It is real and it belongs in your comparison. It is also broker specific and direction specific, so no article can tell you what yours will be. Look up your own rate, multiply by the nights you expect to hold, and put it next to the spread you would have paid trading daily instead. Whichever way it comes out, you will at least be deciding with your own numbers.
Can I do both?
You can, but treat them as two separate operations with separate records, or your data becomes unreadable. The common failure is not running two approaches, it is running one and calling it the other when a day trade goes wrong and gets held overnight. That is not swing trading. That is a day trade you did not close.
Do these numbers apply to markets other than gold?
The shape of the relationship holds widely, distance growing roughly with the square root of time while costs grow linearly. The specific percentages are gold's and should not be carried across. Measure your own instrument if you want the figure that applies to you.
Where This Leaves You
The comparison is not really between two identities. It is between two ways of paying for access to the same movement, and the market is indifferent to which you choose.
What the benchmark says clearly is that time is generous with distance in a way that frequency is not generous with cost. Holding longer gives you more of the market's movement per toll paid, and fewer moments where your own judgement is the weak link. That is not a promise that the longer horizon will make money, because nothing here can promise that. It is an observation that it asks less of you to break even, and asking less of yourself is a reasonable design principle for an account you intend to still have in two years.
Pick the horizon your costs and your calendar can carry, write it down, and stop revisiting it every time a chart looks exciting. If you want the longer view on why that steadiness matters more than any single decision, why trading is a marathon not a sprint covers it, and how to protect your capital when gold gets volatile is the piece I would read first.
If you want that in a form you can keep, the Black Gold Market blueprint is free. It is a short document, not a course. There is nothing to buy to follow along, and an optional Kit if you want more structure later. We do not sell certainty, and we publish no profit claims.
About the author. Raphael writes the Black Gold Market journal. He works on the view that most accounts are lost to structure rather than to analysis, and that the level, the context and the risk are worth more attention than the entry.
Disclaimer: This article is general educational content about how market data and trading costs behave. It is not financial advice and it is not a recommendation to buy or sell anything. Trading gold, CFDs and leveraged products carries a high risk of losing money rapidly. No entry, stop or target discussed should be treated as a signal. All statistics are computed from the published LBMA Gold Price PM benchmark for 2016 to 2025, with the assumptions stated in the article, and external figures are linked so you can check them.