

How to avoid going on tilt while trading is a question I get asked in the wrong tense. People ask it the evening after, when the damage is already booked and what they actually want is absolution. Asked then, there is no useful answer. Asked before, there is a very good one, and it has almost nothing to do with willpower.
Tilt is not a mood. It is a specific, recognisable sequence: a trigger lands, your assessment of risk changes without you noticing, and you take trades you would not have taken an hour earlier. The feeling is the symptom. The staking decision is the disease, and that part is measurable.
Everything numerical below is my own calculation from assumptions I will state as I go, except where I cite a source. You can redo any of it.
What tilt actually is, named by a game that measured it first
The word comes from poker, which had an advantage our field lacks: millions of hands recorded, with the stake and the outcome attached to each one. Players on tilt were not identifiable by mood. They were identifiable by the fact that their average stake rose after a loss and their standard of entry fell.
Carry that definition over and tilt in a trading account is this: the size of your risk becomes a function of your last result rather than of your plan. That is a testable statement about your own records. If your average risk per trade after a loser is larger than after a winner, you tilt. You do not have to feel anything in particular for it to be true.
How to avoid going on tilt while trading starts with the trigger, not the feeling
By the time it feels like anything, the useful window has closed. So the work is to name the triggers in advance and attach a mechanical response to each one, in writing, while calm.
The triggers worth naming are specific. A stop hit by a few units before price turns and goes where you expected. A trade closed early for a small gain that then ran a long way without you. A position you were right about but too small to matter. A run of losses with nothing obviously wrong in any of them. Two signals from the same source pointing opposite ways within a few hours, which is more common than it should be and leaves you with no read at all.
Notice none of those is a large loss. A large loss tends to produce caution. The classic tilt trigger is a small loss attached to a sense of unfairness, and unfairness is the ingredient that makes people want to get it back.
What the spiral costs, with the assumptions on the table
Here is why the staking matters more than the feeling. Two traders take the same seven losing trades in a row. The first risks a flat 1 per cent of current equity every time. The second starts at 1 per cent and doubles the fraction risked after each loss, which is what getting it back looks like when written down honestly.
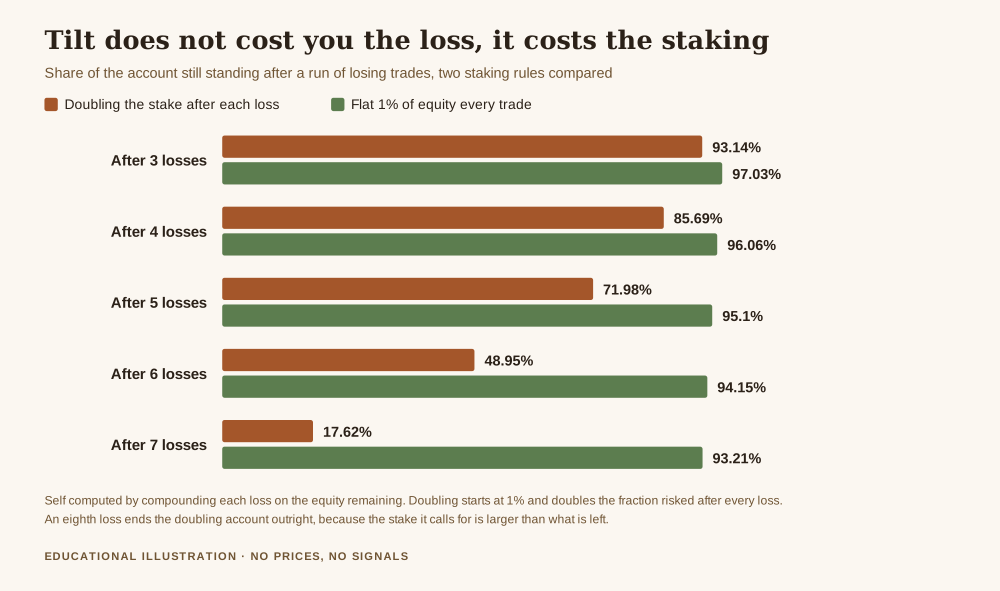
After three losses the two are close: 97.03 per cent of the account remains under flat risk, 93.14 per cent under doubling. This is the part that fools people. Three deep into a spiral, the damage still looks survivable, which is precisely why nobody stops there.
After five, it is 95.10 against 71.98. After six, 94.15 against 48.95. After seven, 93.21 against 17.62.
Read the two columns side by side. The flat trader has given up 6.8 per cent of the account across a genuinely bad run and will recover it in the ordinary course of business. The doubling trader has lost 82.4 per cent and will not, because recovering from 17.62 per cent requires a 468 per cent gain. And there is no eighth row, because the eighth loss ends the doubling account outright: the stake the rule calls for is larger than what is left.
The losses were identical. Only the staking rule differed.
The run that sets it off is completely normal
Now the number that I think does the most good, because it attacks the premise rather than the behaviour.
The spiral starts with a belief: this run is abnormal, so something must be done. Let me test that. Assume 200 trades in a year, each independent, with no drift in your edge. I computed the exact probability of hitting at least one losing streak of a given length using dynamic programming over the streak state, so these are not simulations.
At a 50 per cent win rate, the probability of at least one run of five losses in the year is 96.6 per cent. Of six losses, 80.1 per cent. Of seven, 54.4 per cent. Of eight, 32.0 per cent.
At a 55 per cent win rate, a good one, a run of five is still 88.0 per cent likely and a run of six is 60.2 per cent likely.
At 45 per cent, which is perfectly workable if your winners are larger than your losers, a run of six is 93.0 per cent likely.
So a six loss streak is not evidence that anything is broken. At a 50 per cent win rate it is the single most likely thing to happen to you this year, more likely than not. The trigger that starts the spiral is, in the overwhelming majority of cases, an entirely ordinary feature of a sound process. You are not being singled out. You are being sampled.
Get the free Black Gold Market blueprint, a short document on protecting capital and building the habits this article describes. One email, no spam, unsubscribe anytime.
Get the free blueprint →What the research actually establishes
I want to be careful here, because trading psychology attracts confident claims with nothing underneath them.
There is a well documented bias in the direction this article describes. Terrance Odean's Are Investors Reluctant to Realize Their Losses?, published in The Journal of Finance in October 1998, volume 53, issue 5, pages 1775 to 1798, analysed trading records for 10,000 accounts at a large discount brokerage. It documents the disposition effect: a strong preference for realising winners rather than losers, which Odean found was not explained by rebalancing or by transaction costs. I verified the paper's identity through Crossref against the digital object identifier 10.1111/0022-1082.00072 before citing it, and read the abstract from the paper itself.
That is adjacent to tilt rather than identical to it. It is evidence that losses are handled differently from gains at the level of the decision, in a large real sample, which is the foundation the spiral is built on. It is not evidence about stake escalation in a leveraged gold account, and I am not going to pretend otherwise.
The second figure worth knowing is regulatory. In its product intervention measures of March 2018, the European Securities and Markets Authority reported that analyses by national regulators found 74 to 89 per cent of retail accounts typically lose money, with average losses per client ranging from 1,600 to 29,000 euros. That is the population this article is written for, and the spread of those averages is itself suggestive. The gap between a 1,600 euro loss and a 29,000 euro loss is not mostly a gap in market knowledge. It is a gap in what happened after the bad run started.
Three circuit breakers, chosen because they are not decisions
Everything that works here has one property: it does not require judgement at the moment judgement is worst.
One, a stake that cannot respond to the last result. Fix the risk per trade as a percentage of equity and compute it from the account, not from how you feel. The chart above is the entire argument for this. If the fraction cannot move, the spiral has no mechanism, whatever your mood does. This is the same discipline as position sizing so one trade cannot hurt you, applied to the one moment it is most likely to be abandoned.
Two, a stop rule written in advance with a number in it. Not "stop when you feel off", which is unenforceable. Something countable: after three consecutive losses, or after a daily loss of a set number of R, the platform closes for the day. Pick the threshold while calm and accept that it will sometimes stop you on a day that would have recovered. That is the premium you pay for the days it saves.
Three, a cost estimate you have actually looked at. Suppose your edge is worth 0.10R per trade when you are following your process, and that while tilted you are instead giving back 0.20R per trade through worse entries and sizing. Those are my illustrative assumptions, not measured facts, and you should replace them with your own numbers from your own records. On them, eight trades taken in a tilted state cost 1.6R, against the 0.8R the same eight would have earned, a swing of 2.4R. Three trades cost a swing of 0.9R. Knowing roughly what the window costs is what makes closing the platform feel like a decision rather than a defeat.
If the trigger you keep meeting is frequency rather than size, the companion piece is overtrading, the habit that drains your account. If it is the specific flavour of getting even with the market, how to stop revenge trading covers that directly, and how to control emotions in trading sits underneath all three.
What this article is not saying
It is not saying you can eliminate the feeling. You cannot, and arrangements that depend on you not feeling anything fail at exactly the wrong moment. The point is to make the feeling expensive to act on rather than rare.
It is not saying a losing streak means your method is fine. Streaks are normal, and methods do also break. The difference is that one is diagnosed from a sample of results reviewed calmly, days later, and the other is diagnosed in the moment by someone who has just lost money. Only the first is worth anything.
It is not saying flat percentage risk is the only defensible rule. Reasonable people size differently. What the arithmetic rules out is any rule where the stake rises because the last one lost.
And it is not giving you a threshold. I have not told you how many losses should close your day, because that number depends on your win rate, your distribution and your circumstances, and anyone who hands you a universal figure has not done the arithmetic.
Frequently asked questions
What does going on tilt actually mean in trading?
It means your risk per trade has started responding to your last result instead of to your plan. It is visible in your records as a larger average stake after losses than after wins, whether or not you noticed any emotion at the time.
How to avoid going on tilt while trading, in one sentence?
Fix the stake so it cannot respond to the last result, and write a countable stop rule in advance, because both work without requiring good judgement at the moment judgement is worst.
Is a six loss streak a sign my strategy has stopped working?
Usually not. On the assumptions above, at a 50 per cent win rate over 200 trades a year, the chance of at least one six loss run is 80.1 per cent. It is the expected experience of a working process, not a warning.
Why does doubling after a loss feel reasonable at the time?
Because the early steps genuinely are survivable. Three losses into the doubling path, 93.14 per cent of the account is still there. The arithmetic only turns sharply at the end, which is after the decision to continue has already been made several times.
Should I stop trading for a fixed number of days after a bad run?
That is a decision about your own records and circumstances, and the honest answer is that a rule chosen in advance beats a choice made afterwards, whatever the length. The cost of pausing is real and worth estimating rather than ignoring.
Does a bigger account make tilt less dangerous?
No. Every figure in the chart is a percentage of equity, so the spiral behaves identically at any account size. What changes with a larger account is only the amount of money attached to the same percentages.
Where Black Gold Market fits
Black Gold Market is a free journal about reading gold and protecting capital, written for people who would rather measure something than be told what to do. Nothing here is sold on a promise of returns, and there is no signal service. The free blueprint is a short document on protecting capital and building exactly the kind of mechanical habit this article argues for, and it asks only for an email you can unsubscribe from. The piece underneath all of it is how to protect your capital when gold gets volatile.
About the author. Raphael writes Black Gold Market. He kept a record of his stake size next to his last result for a month, found the pattern he had been confident was not there, and changed the rule rather than the resolution. What matters to him is the level, the context, and the risk, in that order.
This article is educational and is not financial advice. Trading gold and other leveraged products carries a high risk of losing money rapidly, and no entry, stop or target discussed should be treated as a signal. The equity figures and streak probabilities above are computed from the stated assumptions and are illustrations of arithmetic, not forecasts or measured results. The disposition effect finding is from Odean, The Journal of Finance, 1998, verified through Crossref, and the loss statistics are the European Securities and Markets Authority's own, as cited. Decide your own risk, and never trade money you cannot afford to lose.