

Somebody in the group posted a screenshot last week of gold up on the year, and somebody else replied that on their platform it was down. Both were right. That is the whole of what follows, and it is why the gold price in different currencies is worth half an hour of your attention even if you only ever trade one pair. The metal does not have a price. It has a price in something, and the something moves too.
I went and measured how much that matters. The record is the afternoon gold auction published by the London Bullion Market Association, which publishes the same auction simultaneously in US dollars, pounds sterling and euros. The euro series starts on 4 January 1999, so I have used that as the common start and run it to 25 September 2026. That is 6,954 auctions where all three currencies are quoted for the identical bar of metal at the identical moment.
Gold price in different currencies means one bar and three answers
Start with the mechanical part, because people skip it and then find the results surprising.
There is one auction. The same participants settle the same contract at the same instant, and the LBMA publishes the result in three currencies. Nothing about the metal differs between them. The only thing that differs is what you are measuring it against, and currencies move against each other every second of the day.
So when a dollar quote rises, exactly two things can have happened, in any combination. Gold can have become more valuable relative to everything. Or the dollar can have become less valuable relative to everything, including gold. The quote cannot tell you which, because it only has one number and there are two moving parts inside it. Reading a second currency is the cheapest way there is to separate them.
Twenty seven years, and the seven where the dollar and the euro disagreed
Taking the last auction of each year and comparing it with the last auction of the year before gives 27 annual returns in each of the three currencies, covering 2000 through to the partial year 2026, which runs to 25 September.
In seven of those 27 years, the dollar and the euro did not agree on whether gold had gone up or down. Not disagreed about the size, disagreed about the sign. Those years were 2000, 2003, 2004, 2017, 2018, 2021 and the year we are in now. One year in four, the same metal finished up in one major currency and down in another.
The current year is one of them, which is what caused the argument in the group. To 25 September 2026, gold is down 2.44 per cent in dollars and up 0.68 per cent in euros. Both screenshots were accurate. Neither person was reading a different market.
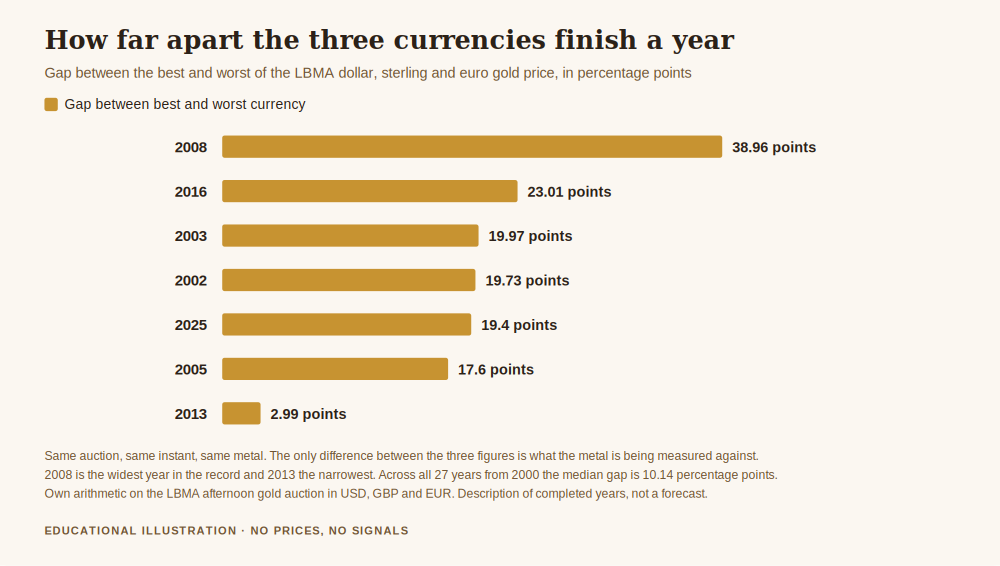
The size of the disagreement is the part I did not expect. For each year I took the best performing of the three currencies and subtracted the worst. The middle of that distribution is 10.14 percentage points. In a typical year, the answer to how much gold returned differs by more than ten points depending on which currency you ask in. That is not a rounding difference. For most of these years it is larger than the entire return in one of the three.
The narrowest year on record is 2013, at 2.99 points, when gold fell heavily in all three and the currencies barely mattered. The widest, by a distance, is 2008.
2008, the year the gap was widest
In 2008 gold finished up 4.32 per cent in US dollars. A flat year, the kind you would describe as nothing much happening, in the middle of the largest financial crisis in living memory.
In sterling, the same year, the same metal, the same auction, gold finished up 43.28 per cent.
The gap is 38.96 percentage points, and none of it is about gold. Sterling fell heavily against the dollar through the second half of that year, so a British holder of gold got the metal's modest move plus the whole of the currency's decline. A dollar holder got only the modest move. Both are correct measurements of the same auction. The euro, for completeness, came in at 8.31 per cent, sitting between the two.
This is why I am wary when someone says gold protected them in a given year, or failed to. It protected them in the currency they spend. Those are different sentences and only one of them is usually being tested.
Recent years show the same effect running the other way. In 2017 gold rose 12.66 per cent in dollars and fell 1.39 per cent in euros. In 2005 it rose 17.77 per cent in dollars and 35.37 per cent in euros, nearly twice as much. Over the whole 27 years the three averages are close together, at 11.81 per cent a year in dollars, 12.58 in sterling and 11.03 in euros, which tells you the currency effect is not a permanent advantage to anyone. It washes out over decades. It does not wash out over the two or three years that most traders actually measure themselves across.
How much of a dollar move is actually about the dollar
Annual figures are vivid but too coarse to plan around, so I ran the same question on monthly changes, which gives 332 months.
The monthly standard deviation of gold is 4.910 per cent in dollars, 4.859 in sterling and 4.596 in euros. Those are close, and they should be, because the dominant thing moving all three is the metal.
Now subtract the euro return from the dollar return, month by month. What is left is almost purely the currency, and its standard deviation is 2.689 per cent a month. That is 54.8 per cent of the size of the dollar move itself. Put plainly, the month to month wobble that comes from the exchange rate alone is more than half as large as the whole move you see on your dollar chart.
Decomposing the variance rather than the standard deviation makes it sharper. The variance of the monthly dollar return is 24.108. The variance of the euro return is 21.125 and the variance of the currency component is 7.229, with a covariance term of minus 4.247 that partly cancels the other two. The currency component is 30.0 per cent of the dollar variance before that cancellation is applied. Roughly speaking, and I want to be careful with the word roughly here, something like a quarter to a third of what your dollar chart does month to month is not the metal.
The two series still correlate at 0.842, so this is not a claim that they are different markets. They move together most of the time. But 62 of the 332 months, which is 18.7 per cent, finished with opposite signs in the two currencies. Nearly one month in five, the dollar chart and the euro chart told a trader two different stories about the same four weeks.
What this changes, and what it does not
It does not give you a trade. There is no signal in here, no pair to buy against another, and nothing about where the currency is going next. Everything above is a description of what has already happened.
It does not mean your dollar chart is wrong. If your account is denominated in dollars and your costs are in dollars, the dollar chart is the correct chart for your profit and loss, and you should keep using it.
What it does change is what you conclude from a move. When gold rises three per cent in a week and the story going round is central bank demand or a safe haven bid, it is worth thirty seconds to check whether it rose three per cent in euros too. If it did, something happened to gold. If it barely moved in euros, something happened to the dollar, and the gold story you were about to act on is a currency story wearing a different hat. That habit costs nothing and it has saved me from more than one confident conclusion.
It also changes how you read your own results if you live outside the dollar. An account that gained eight per cent in a year when the dollar fell ten per cent against your home currency has not made you better off, and the account statement will not mention it. That belongs in the same file as knowing how much gold moves in a day before sizing a position: unexciting measurements that decide whether the number you are looking at means what you think it means.
The mechanism underneath all of this is the one in how the US dollar affects the price of gold, and the job it serves is protecting your capital when gold gets volatile. You cannot protect capital from a risk you have not noticed you are carrying, and if you trade gold in dollars while you live somewhere else, you are carrying two.
Get the free Black Gold Market blueprint, a short document on protecting capital before you try to grow it, including how to tell a metal move from a currency move before you act on it. One email, no spam, unsubscribe anytime.
Get the free blueprint →Frequently asked questions
Why is the gold price in different currencies not simply the same number converted?
It is exactly that, and that is the point. The LBMA publishes one auction in three currencies, so the euro figure is the dollar figure passed through the exchange rate at that moment. Nothing is being measured differently. The reason the annual returns diverge is that the exchange rate itself moved over the year, so the same conversion applied at two different dates gives two different answers about how much changed.
Which currency should I use to judge how gold is doing?
For your profit and loss, the one your account settles in, because that is the money that leaves and arrives. For judging whether something happened to gold as opposed to your currency, look at two and compare. Those are separate questions and using one answer for both is where the confusion starts.
Is gold a hedge against my own currency falling?
The record shows that a holder in a weakening currency received the metal's move plus the currency's decline, which in 2008 meant 43.28 per cent in sterling against 4.32 per cent in dollars. I would stop short of turning that into a general claim. It describes what happened in particular years to a particular currency, the effect runs in both directions, and over the full 27 years the three currencies averaged within about one and a half points of each other a year. It is a real effect on the horizon most people measure over and close to nothing on the horizon most people quote.
Does this mean the dollar chart is misleading?
No. It means the dollar chart answers one question rather than two. It correctly tells a dollar account what its position is worth. It cannot tell you whether a move came from the metal or from the dollar, because a single quote has one number and that question has two parts. A second currency separates them in about thirty seconds.
Does any of this predict what comes next?
Not at all, and I would be careful of anyone who says otherwise. Everything above is a description of 27 completed years. The currency component being large in the past says nothing about its direction in the future, and there is no position anywhere in this article.
Where did these numbers come from?
All of them are my own arithmetic on the LBMA afternoon gold auction, linked above, in US dollars, pounds sterling and euros, from 4 January 1999 to 25 September 2026, which is 6,954 auctions where all three are quoted. Annual returns compare the last auction of each year with the last of the year before, so 2026 is a partial year to 25 September and I have labelled it as such throughout. Monthly figures use the last auction of each month, giving 332 changes. The currency component is the dollar return minus the euro return, month by month. Standard deviations and the variance decomposition are ordinary sample statistics on those series. No gold price level appears anywhere in this article.
About the author. Raphael writes Black Gold Market. He is slow to accept a story about why gold moved, and checking the same auction in a second currency is one of the cheapest ways he knows to find out whether the story is about gold at all. Nothing in this article is a recommendation to trade, and no entry, stop or target discussed should be treated as a signal.