

Every gold trader gets asked some version of this at a family dinner, and most of us answer too quickly. Does gold go up when stocks go down? The short answer is that it often does, that the effect is real enough to have been measured in peer reviewed work, and that it is nowhere near reliable enough to be treated as a rule you can lean your account against. The longer answer is more useful, because it tells you exactly when the relationship is most likely to fail, which is usually the week you were counting on it.
I want to separate three things that get blended together in the usual conversation: what the research found, what the arithmetic of correlation does to your risk, and what any of it changes about how you size a position tomorrow morning.
Does Gold Go Up When Stocks Go Down, According to the Research
The cleanest framing I know comes from a 2010 paper by Dirk Baur and Brian Lucey in the Financial Review, Is Gold a Hedge or a Safe Haven? An Analysis of Stocks, Bonds and Gold. Their contribution was to stop using the two words as synonyms. A hedge, in their definition, is an asset that is uncorrelated with stocks or bonds on average. A safe haven is an asset that is uncorrelated with stocks and bonds specifically in a market crash. Those are different claims, and an asset can satisfy one without satisfying the other.
Studying United States, United Kingdom and German stock and bond returns against gold returns, they found that gold is a hedge against stocks on average and a safe haven in extreme stock market conditions. So far this sounds like a straightforward yes. The sentence that matters more sits at the end of their abstract: a portfolio analysis further shows that the safe haven property is short lived.
Read that again, because it is the whole article in one line. The protective behaviour shows up when equities fall hard, and then it fades. It is not a standing property of gold that you can assume is switched on next Tuesday. It is something that appears under particular conditions and decays afterwards. A companion study by Baur and Thomas McDermott in the Journal of Banking and Finance, Is gold a safe haven? International evidence, extended the same question across a wider set of markets, and the existence of that follow up is itself a hint: this is a question where the answer depends on which market, which period and which definition you use.
I checked both of those references through Crossref before quoting them, which is a habit worth copying. The gold conversation online is full of confidently cited studies that turn out to say something narrower than the person quoting them believes.
The Word Average Is Carrying a Great Deal of Weight
When somebody tells you gold is negatively correlated with stocks, ask them over what window. A correlation measured across twenty years is an average of thousands of days, and it can be mildly negative while containing long stretches of strongly positive behaviour. The average tells you about the period as a whole. It tells you very little about the fortnight you happen to be holding a position.
This is not a technicality. It is the difference between a statement that is true and a statement that is useful. If you hold gold partly because you expect it to rise when your other exposure falls, you are not relying on the twenty year average. You are relying on the correlation that will be in force during the specific days your other exposure falls. Those are usually days when everything is moving at once, and that is precisely when the historical average is least representative.
What Correlation Actually Does to Your Risk
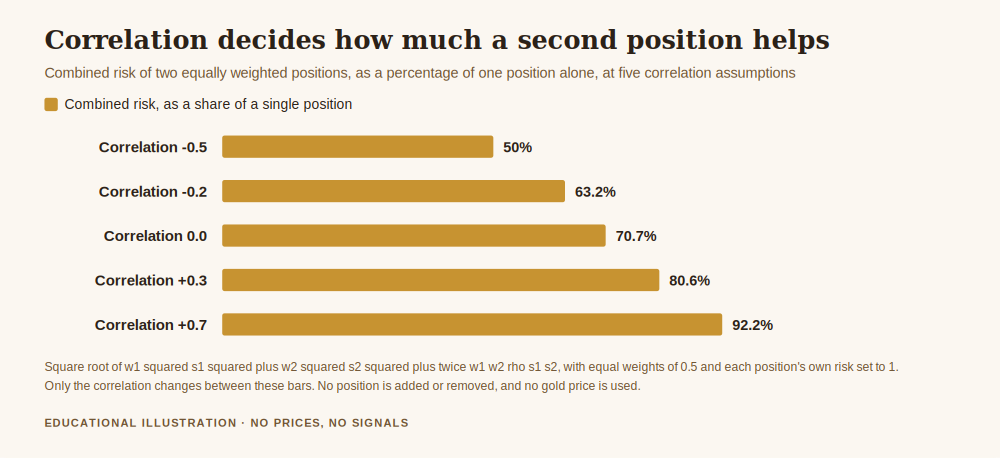
Here is the arithmetic, because this is the part a trader can act on. Suppose you hold two positions of equal weight, and suppose each one, on its own, carries the same amount of risk. Call that one unit each. The combined risk of the pair is the square root of w1 squared times s1 squared, plus w2 squared times s2 squared, plus twice w1 times w2 times the correlation times s1 times s2. With equal weights of 0.5 and each position's own risk set to 1, the only thing left that can move is the correlation.
At a correlation of minus 0.5, the combined risk comes out at 0.500, or 50.0 per cent of what a single position carries. At minus 0.2 it is 63.2 per cent. At zero it is 70.7 per cent. At plus 0.3 it is 80.6 per cent. At plus 0.7 it is 92.2 per cent. Those are not estimates, they are the formula evaluated at five points, and you can reproduce every one of them in three lines of code.
Now look at what that means in practice. If the correlation you assumed was minus 0.2, and during a stressed week it drifts to plus 0.6, your combined risk rises from 0.632 to 0.894. That is an increase of 41.4 per cent in the risk you are carrying, and you did not open a single new position to earn it. The market revalued your diversification while you were asleep.
There is a second way to read the same numbers that I find clarifying. The best possible case, a correlation of minus 1, would drive combined risk to zero. The worst case, a correlation of plus 1, leaves it at 1.000, which is to say two positions behaving as one position of double the size. Measured against that range, a correlation of minus 0.2 keeps 36.8 per cent of the available diversification benefit. A correlation of zero keeps 29.3 per cent. Plus 0.3 keeps 19.4 per cent. Plus 0.6 keeps 10.6 per cent. Diversification is not a switch that is on or off, it is a dial, and the market holds it.
Why Gold Sometimes Falls on Exactly the Day You Needed It Not To
The mechanism is worth understanding because it explains the failures rather than explaining them away. When a sharp equity decline forces leveraged holders to raise cash, they do not sell the position they are most pessimistic about. They sell what they can sell quickly and at a fair price. Gold is deeply liquid, which is one of the reasons people hold it, and that same liquidity makes it an efficient thing to sell when the cash call arrives. So the very quality that makes gold attractive as protection is the quality that can turn it into a source of funds during the worst two days of a decline.
You do not need to take my word for the forced selling part, because the retail version of it is written into European regulation. When the European Securities and Markets Authority restricted contracts for difference for retail clients, the package it agreed included leverage limits on opening positions, a margin close out rule on a per account basis, and negative balance protection on a per account basis. You can read the ESMA announcement directly. A margin close out rule is exactly the thing described above, operating on your account rather than on an institution's balance sheet. When equity falls past a threshold, positions are closed because the rule says so, not because anybody formed a view. That is forced selling with your name on it.
So the honest version of the answer is this. Gold has behaved as a safe haven in extreme equity declines in the periods academics have studied, the effect is short lived, and during the most violent phase of a decline gold can be sold for reasons that have nothing to do with gold.
What This Changes for a Trader Rather Than an Investor
An investor holding gold for years is playing the averages, and the averages are on the side of the research above. A trader holding a position for days is not playing the averages at all. A trader is exposed to one particular draw from the distribution, and the distribution has fat, awkward tails.
The practical consequence is that correlation belongs in your position sizing, not in your conviction. If two of your open positions tend to move together, the risk you have taken is larger than the sum of the two lines in your platform suggests, and the numbers above tell you by how much. If you are holding gold as an offset to something else, write down the correlation you are assuming and the level at which you would stop believing it. An assumption you have written down can be tested. An assumption you are carrying in your head just quietly becomes a fact.
It also changes what a surprise means. If gold falls on a day when equities fall and you expected the opposite, that is not evidence the relationship is broken forever, and it is not evidence that you were robbed. It is one observation from a distribution whose shape was described in 2010. The people who get hurt are the ones who treated a tendency as a guarantee, then sized as if the guarantee were real.
The Base Rate That Sits Underneath All of This
One more number, for context rather than for drama. The same ESMA work published the evidence base behind its decision, including national regulator findings that between 74 and 89 per cent of retail accounts typically lose money on these products, with average losses per client running from around 1,600 to 29,000 euro. That is not a prediction about you, and it is not an argument against trading. It is a reminder that the margin for error in this activity is thin, and that a mistaken assumption about correlation is one of the quieter ways people consume theirs.
Gold is a genuinely useful instrument and the research supports a real, measurable protective tendency. It simply does not support the sentence most people want, which is that gold goes up when stocks go down. What it supports is narrower: gold has tended to hold up in extreme equity declines, briefly, and with exceptions you will feel personally if you sized for certainty.
Get the free Black Gold Market blueprint, a short document on protecting capital before you try to grow it, including how to account for correlation between open positions. One email, no spam, unsubscribe anytime.
Get the free blueprint →Frequently Asked Questions
So does gold go up when stocks go down, yes or no?
Often, not always, and the tendency is strongest exactly when equities fall hard. Baur and Lucey found gold acts as a hedge against stocks on average and as a safe haven in extreme stock market conditions, while also finding that the safe haven property is short lived. Treat it as a tendency with a known expiry, not as a rule.
Can I hold gold to offset another position?
You can, as long as you size for the correlation you might get rather than the one you hope for. Two equally weighted positions at a correlation of plus 0.6 carry 89.4 per cent of the risk of a single position, against 63.2 per cent at minus 0.2. If your plan only works at the friendly number, it is not a plan.
Why does gold sometimes fall alongside stocks?
Because in a sharp decline, leveraged holders raise cash by selling what is liquid, and gold is liquid. The retail version is a margin close out rule, which closes positions when account equity falls past a threshold regardless of anyone's opinion about gold.
Does a long term chart settle the question?
No, because a long term correlation is an average over thousands of days and you will be holding on a handful of them. The average describes the period. It does not describe your fortnight.
Where did the numbers in this article come from?
The correlation figures are the standard two position variance formula evaluated at five correlation values, with equal weights of 0.5 and each position's own risk set to 1. They assume the two risks are equal and stable, which is a simplification stated so you can disagree with it. The academic findings are quoted from papers whose DOIs were verified through Crossref, and the regulatory figures come from the linked ESMA announcement.
Where Black Gold Market Fits
Black Gold Market is free to follow. Daily XAU/USD analysis with the level, the context and the risk stated before the outcome is known, losing days included. There is a free blueprint for anyone who wants the capital protection material in one place, and an optional Kit for people who want the whole method. Nothing here promises a profit, and nothing here is a signal service. If you want the groundwork first, start with how to protect your capital when gold gets volatile, then read why gold rises in times of fear and gold vs real yields for the two forces sitting underneath most of these moves.
Hold the tendency, size for the exception, and write down the correlation you are assuming so that the market cannot quietly change it for you.
About the author. Raphael writes Black Gold Market. He is more interested in what an asset does on its worst week than in what it averages over a decade, because the worst week is the one that decides whether you are still trading afterwards. Nothing in this article is a recommendation to trade, and no entry, stop or target discussed should be treated as a signal.