

Someone in the channel sent me a spreadsheet last week. Two per cent a month, compounded, starting from four thousand dollars. By year three the cell at the bottom read a number large enough that he had highlighted it in green. He wanted to know whether the plan was realistic. The honest answer took me longer to write than the spreadsheet took him to build, because almost everything written about compound trading for beginners stops at the part that is easy to calculate and skips the part that decides the outcome.
The easy part is the exponent. Anyone can put 1.02 to the power of 36 into a cell. The part nobody puts in the spreadsheet is that the returns being compounded are not a fixed number. They vary, and the variation itself takes a bite out of the result, every month, whether or not the average is positive. That bite has a name and an exact size, and once you can calculate it the green cell stops looking like a plan and starts looking like what it is, which is the best case of a distribution.
Everything numerical below is my own calculation from assumptions I state as I go, or a figure quoted from a source I link. There are no gold prices here, nothing is a forecast, and every percentage used as an example is a fixed illustration I chose to make the arithmetic visible, not a target, a result or a suggestion of what anyone should expect.
The first thing compounding does is punish losses more than it rewards gains
Start with the asymmetry, because it is the foundation and it is the part most people can state but few have actually calculated. If you lose a percentage of your capital, the gain required to get back to where you started is always larger than the loss. The formula is exact: the gain you need equals one divided by one minus the loss, less one.
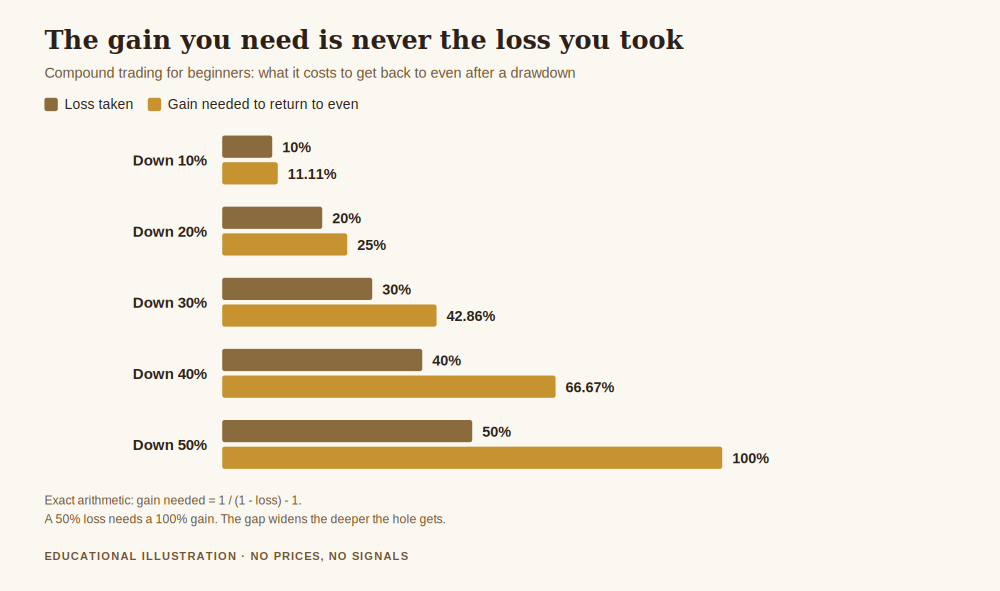
Run the numbers and the shape is clear. Down 10 per cent needs 11.11 per cent to recover. Down 20 per cent needs 25 per cent. Down 30 per cent needs 42.86 per cent. Down 40 per cent needs 66.67 per cent. Down 50 per cent needs a 100 per cent gain, which is to say you must double what is left simply to arrive back where you began.
Notice how the gap behaves. At the shallow end it is almost nothing, barely a percentage point. By the halfway mark it has become the difference between a bad quarter and two years of work. This is why capital protection is not a personality trait or a slogan, it is the thing that keeps the compounding machine in the range where it still functions. A drawdown you cap at 10 per cent costs you an 11.11 per cent recovery. The same account allowed to run to 50 per cent costs you everything you had plus everything again.
The drag: why the average return is not the return you get
Here is the part the spreadsheet never includes, and it is the single most useful idea in this article.
When returns compound, they multiply rather than add. That means the result depends on the geometric mean of the returns, not the arithmetic mean that people quote. Those two numbers are not the same, and the gap between them grows with the size of the swings.
Take the cleanest possible example. A month of plus 10 per cent followed by a month of minus 10 per cent. The arithmetic average is exactly zero. The actual result is not zero, it is a loss, because 1.10 multiplied by 0.90 equals 0.99. The geometric mean per month is minus 0.5013 per cent, and across twelve months of that pattern the account is down 5.852 per cent despite an average return of zero.
Widen the swings and it gets worse quickly. Alternating plus and minus 20 per cent, still an arithmetic average of zero, compounds to minus 21.724 per cent over twelve months. Alternating plus and minus 30 per cent gives minus 43.213 per cent. The average said nothing happened. The account says otherwise.
There is a clean approximation for the size of this effect: the geometric return is roughly the arithmetic return minus half the variance. I checked it against exact calculation at every step above and it holds closely. What it means in practice is that volatility is not merely uncomfortable, it is a direct, calculable subtraction from compounded growth.
Same average, different spread, completely different year
This is where it stops being theory. Take four sets of twelve monthly returns that all share an arithmetic average of plus 1 per cent, and compound each one:
- Twelve steady months of plus 1 per cent compounds to plus 12.683 per cent.
- Six months of plus 6 and six of minus 4 compounds to plus 11.036 per cent.
- Six months of plus 11 and six of minus 9 compounds to plus 6.215 per cent.
- Six months of plus 21 and six of minus 19 compounds to minus 11.362 per cent.
Identical averages. The last one lost money. Nothing separates these four except how widely the months were spread around the same mean, and the spread alone turned a positive average into a negative year.
This is the mechanical reason that consistency beats intensity in a compounding account, and it is not a motivational point. It is arithmetic. The trader with smaller, duller months and the same average finishes ahead of the one with dramatic months, every time, by an amount you can calculate in advance.
What the distribution actually looks like
Averages hide the shape, so I ran the distribution directly. Two hundred thousand simulated twelve month paths, with a fixed random seed so the result is reproducible, drawing each month independently from a normal distribution. These are illustrative assumptions chosen to show the mechanism, not estimates of anyone's trading.
With an arithmetic mean of plus 1 per cent a month and a monthly standard deviation of 6 per cent, the mean ending multiple was 1.1264 while the median was 1.1052, and 31.5 per cent of paths finished below where they started.
Hold the same average and widen the monthly standard deviation to 12 per cent, and the mean ending multiple barely moves, 1.1252, but the median collapses to 1.0386 and 46.4 per cent of paths end below the starting balance. Same edge. Nearly half the outcomes are losses.
That divergence between mean and median is the thing to carry away. The average outcome is lifted by a small number of excellent paths. The typical outcome, the one in the middle, is considerably worse. When someone shows you a compounding projection, they are showing you something closer to the mean of a distribution whose median they have not calculated.
The benchmark nobody sets
Compounding is always compared against zero, which flatters it. The real comparison is against what the money would have done sitting still.
According to the Federal Reserve's H.15 selected interest rates release dated 2 October 2026, the effective federal funds rate was 3.88 per cent per annum on 1 October 2026. Compounded, that is 20.96 per cent over five years and 46.33 per cent over ten, for money that takes no market risk at all.
Now combine that with the drag. Using the half variance relationship, here is the arithmetic monthly mean you would need just to match 3.88 per cent a year after the drag is paid:
- At 3 per cent monthly standard deviation, you need an arithmetic mean of 0.363 per cent a month.
- At 6 per cent, you need 0.498 per cent.
- At 9 per cent, you need 0.723 per cent.
- At 12 per cent, you need 1.038 per cent a month, which is about 13 per cent a year of raw average return, to tie with cash.
That last line is worth sitting with. A trader swinging 12 per cent a month needs to average better than one per cent a month before they have beaten doing nothing. Not before they are rich. Before they are level with a deposit account.
Compound trading for beginners: the four rules the arithmetic actually supports
None of this says compounding does not work. It says compounding rewards a narrower set of behaviours than the spreadsheet suggests. Four things follow directly from the numbers above.
Cap the drawdown before it caps you. The recovery curve is gentle until roughly 20 per cent and punishing after it. Whatever your limit is, it belongs in writing before the week starts, because the arithmetic of digging out gets worse exactly when your judgement does.
Treat volatility as a cost, not a flavour. Half the variance is subtracted from your compounded return whether you notice or not. Two traders with identical averages do not finish in the same place, and the quieter one wins.
Judge the method on the median, not the best run. Nearly half of positive edge paths still finish down over twelve months at realistic variation. A losing year is not proof the method is broken, and a winning year is not proof it works. Both are samples from a distribution.
Know what you are beating. Cash compounds too, without screen time. If the honest comparison has not been made, the plan has not been tested against its cheapest alternative.
Withdrawals, the part that breaks the chain quietly
One more piece of arithmetic, because it is the one that surprises people most. Compounding only happens on money you leave in place. At a steady plus 1 per cent a month, withdrawing none of the gains gives 12.683 per cent over the year. Withdrawing 10 per cent of each month's gain gives 11.35 per cent. Taking out a quarter gives 9.38 per cent, half gives 6.17 per cent, and taking out every month's gain gives exactly zero growth, because you have converted a compounding account into an income stream.
There is nothing wrong with taking income. The error is believing you are doing both at once. The spreadsheet that shows compounding and the plan that pays you monthly are two different plans, and the arithmetic will not let you have both from the same capital.
What this article is not saying
I want the limits stated plainly. Every monthly figure used above is an illustration I fixed in advance to expose the mechanism. None of them is a forecast, a target, a historical result or a suggestion of what is achievable. I have not told you what return is realistic, because I do not know, and neither does anyone showing you a curve.
The simulation assumes months are independent and normally distributed. Real trading months are neither. Losses cluster, and the clustering makes the deep drawdowns more likely than the model says, not less, so the honest reading is that the real distribution is worse than the one I showed.
And nothing here tells you whether compounding suits you at all. That depends on capital you can genuinely leave untouched, which is a question about your life rather than about arithmetic. If you want the groundwork underneath this piece, start with how to protect your capital when gold gets volatile, then what drawdown is and how recovery actually works and what expectancy measures, which is the number the whole machine runs on.
Get the free Black Gold Market blueprint, a short document on protecting capital before you try to grow it, including how to set a drawdown limit you will actually keep. One email, no spam, unsubscribe anytime.
Get the free blueprint →Frequently asked questions
What does compound trading for beginners actually mean?
It means leaving gains in the account so that later gains are calculated on a larger base. The mechanism is real. What is usually left out is that losses compound on the same principle, and that the variation in returns subtracts from the result by a calculable amount every period.
Why does my account fall behind even when my average month is positive?
Because compounding uses the geometric mean, not the arithmetic one. Plus 10 per cent followed by minus 10 per cent averages zero but leaves you down 0.99 times your capital. Across a year of that pattern the account is down 5.852 per cent on an average return of zero.
How much does volatility cost in compounded terms?
Roughly half the variance, subtracted from the arithmetic average. At a 12 per cent monthly standard deviation that is about 0.72 percentage points a month, which is why you would need an arithmetic mean of 1.038 per cent a month just to match a 3.88 per cent annual cash rate.
Is a compounding plan realistic?
The arithmetic is realistic. The constant monthly rate it is usually built on is not, because returns vary, and the variation is what the spreadsheet omits. A projection is only as good as the median of its distribution, and most projections never calculate one.
Should I withdraw profits or leave them to compound?
That is a decision about your circumstances, not something an article can settle, and nothing here is advice. What the arithmetic does say is that you cannot have both from the same capital: withdrawing every month's gain at a steady 1 per cent leaves growth at exactly zero.
Does a losing year mean my method is broken?
Not on its own. In the simulation above, with a genuinely positive average and 12 per cent monthly variation, 46.4 per cent of twelve month paths still finished below where they started. One year is a small sample of a wide distribution, in both directions.
Where Black Gold Market fits
Black Gold Market is a free journal about reading gold and protecting capital, written for traders who would rather understand a mechanism than be handed a conclusion. Everything on the site is free to read and there is nothing to buy to follow along. The optional piece is the Sustainable Trader's Blueprint above, a short document on protecting capital before trying to grow it. We do not promise profits, we do not publish results, and we do not think anyone can tell you what your account will do. The piece this one sits underneath is how to protect your capital when gold gets volatile.
About the author. Raphael writes Black Gold Market. He built his own version of that green spreadsheet years ago, and what changed his mind was not a losing run but sitting down and calculating the median of the distribution he had been quoting himself the mean of. He now prefers the level, the context and the risk to any projection. Nothing in this article is a recommendation to trade, and no entry, stop or target discussed should be treated as a signal.